Indonesia Residential Market Report 2025 H2 and Outlook 2026
EXECUTIVE SUMMARY
MARKET REPORT
Written by
11 February 2026

New House Stagnant Inventory in the middle of Uncertainty
The 2nd Semester of 2025 is a challenging period for developers in the primary market. Our internal data shows a decrease in new house inventory additions. Throughout the period from July to December 2025, the average changes of monthly new house inventory addition experienced a decrease of -14%.
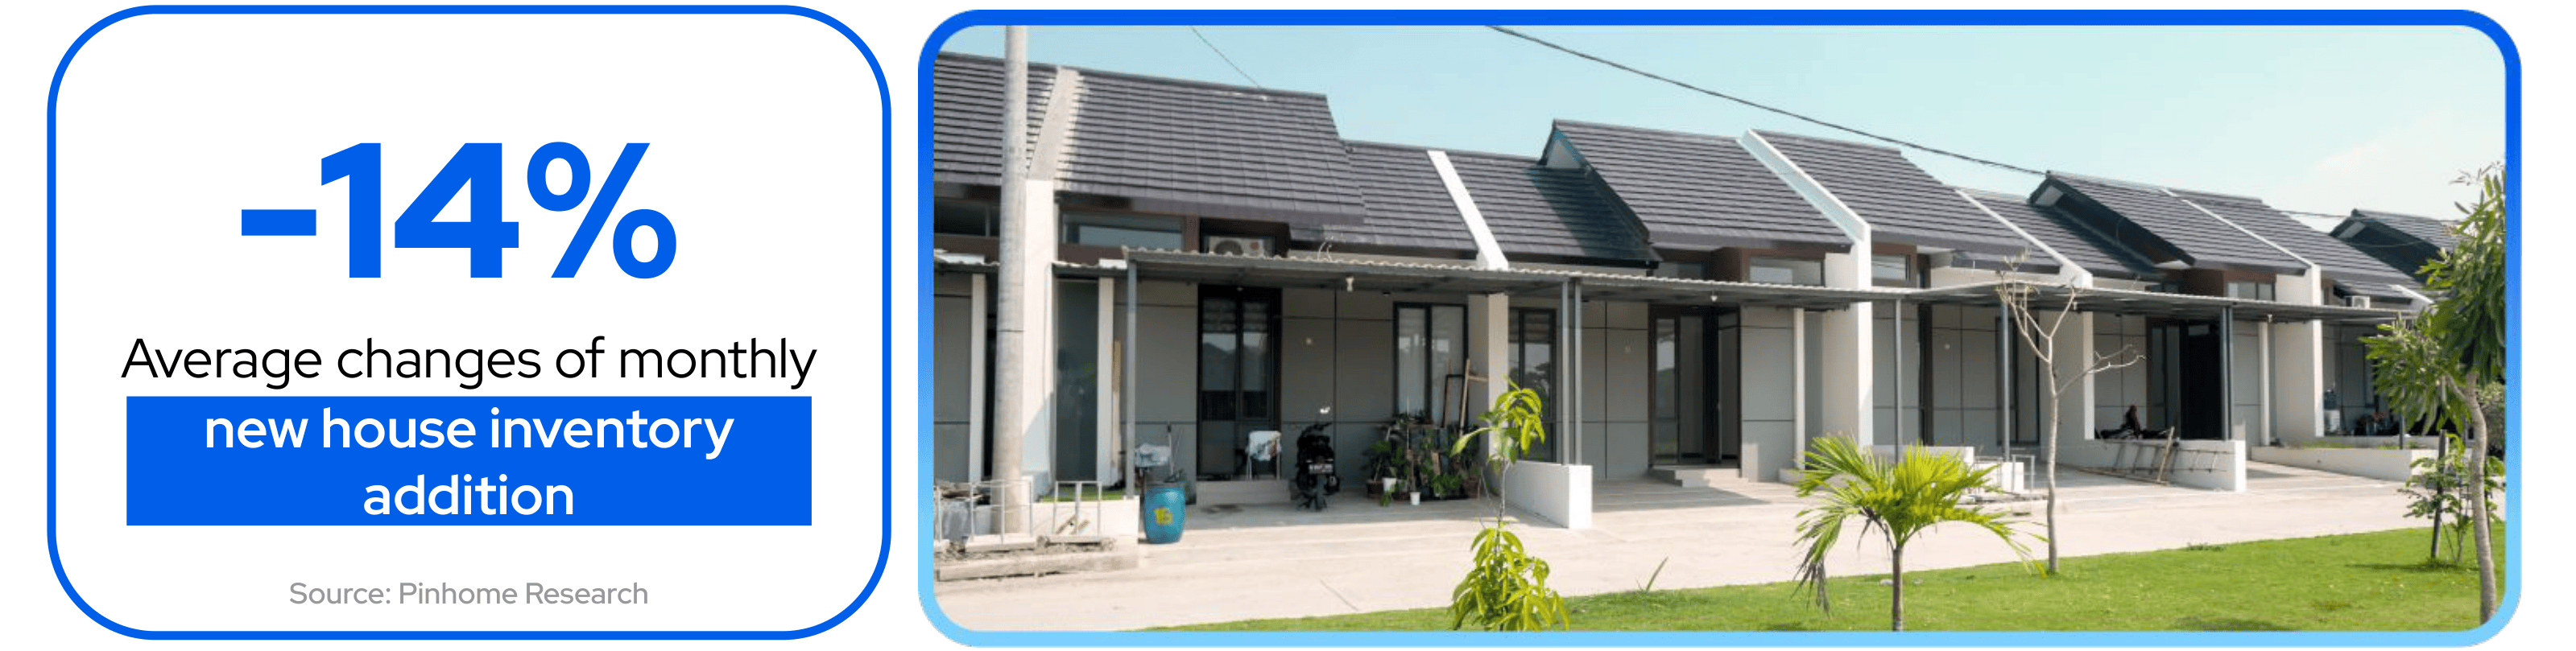
The decrease in the new house inventory volume is developer’s strategic response to two issues:
-
Increase in construction costs: continued impact from the US trade war has driven up the price of imported materials–particularly steel, aluminum, and other mechanical components. This is drastically squeezing the developer’s profit margins. Launching a new product in this period puts developers in a difficult dilemma: increasing selling price despite weak purchasing power, or cutting building specifications, which risks their reputation.
-
Socio-political volatility: The social turbulence in August-September 2025 has led major developers to hold back on new cluster launches, opting to wait for the political climate to stabilize a year following the first year of the new government.
As a result, new house market in the 2nd semester of 2025 is dominated by efforts to clear old inventory while waiting for more conducive momentum.
Pricing Dilemma Amidst Construction Cost Hikes
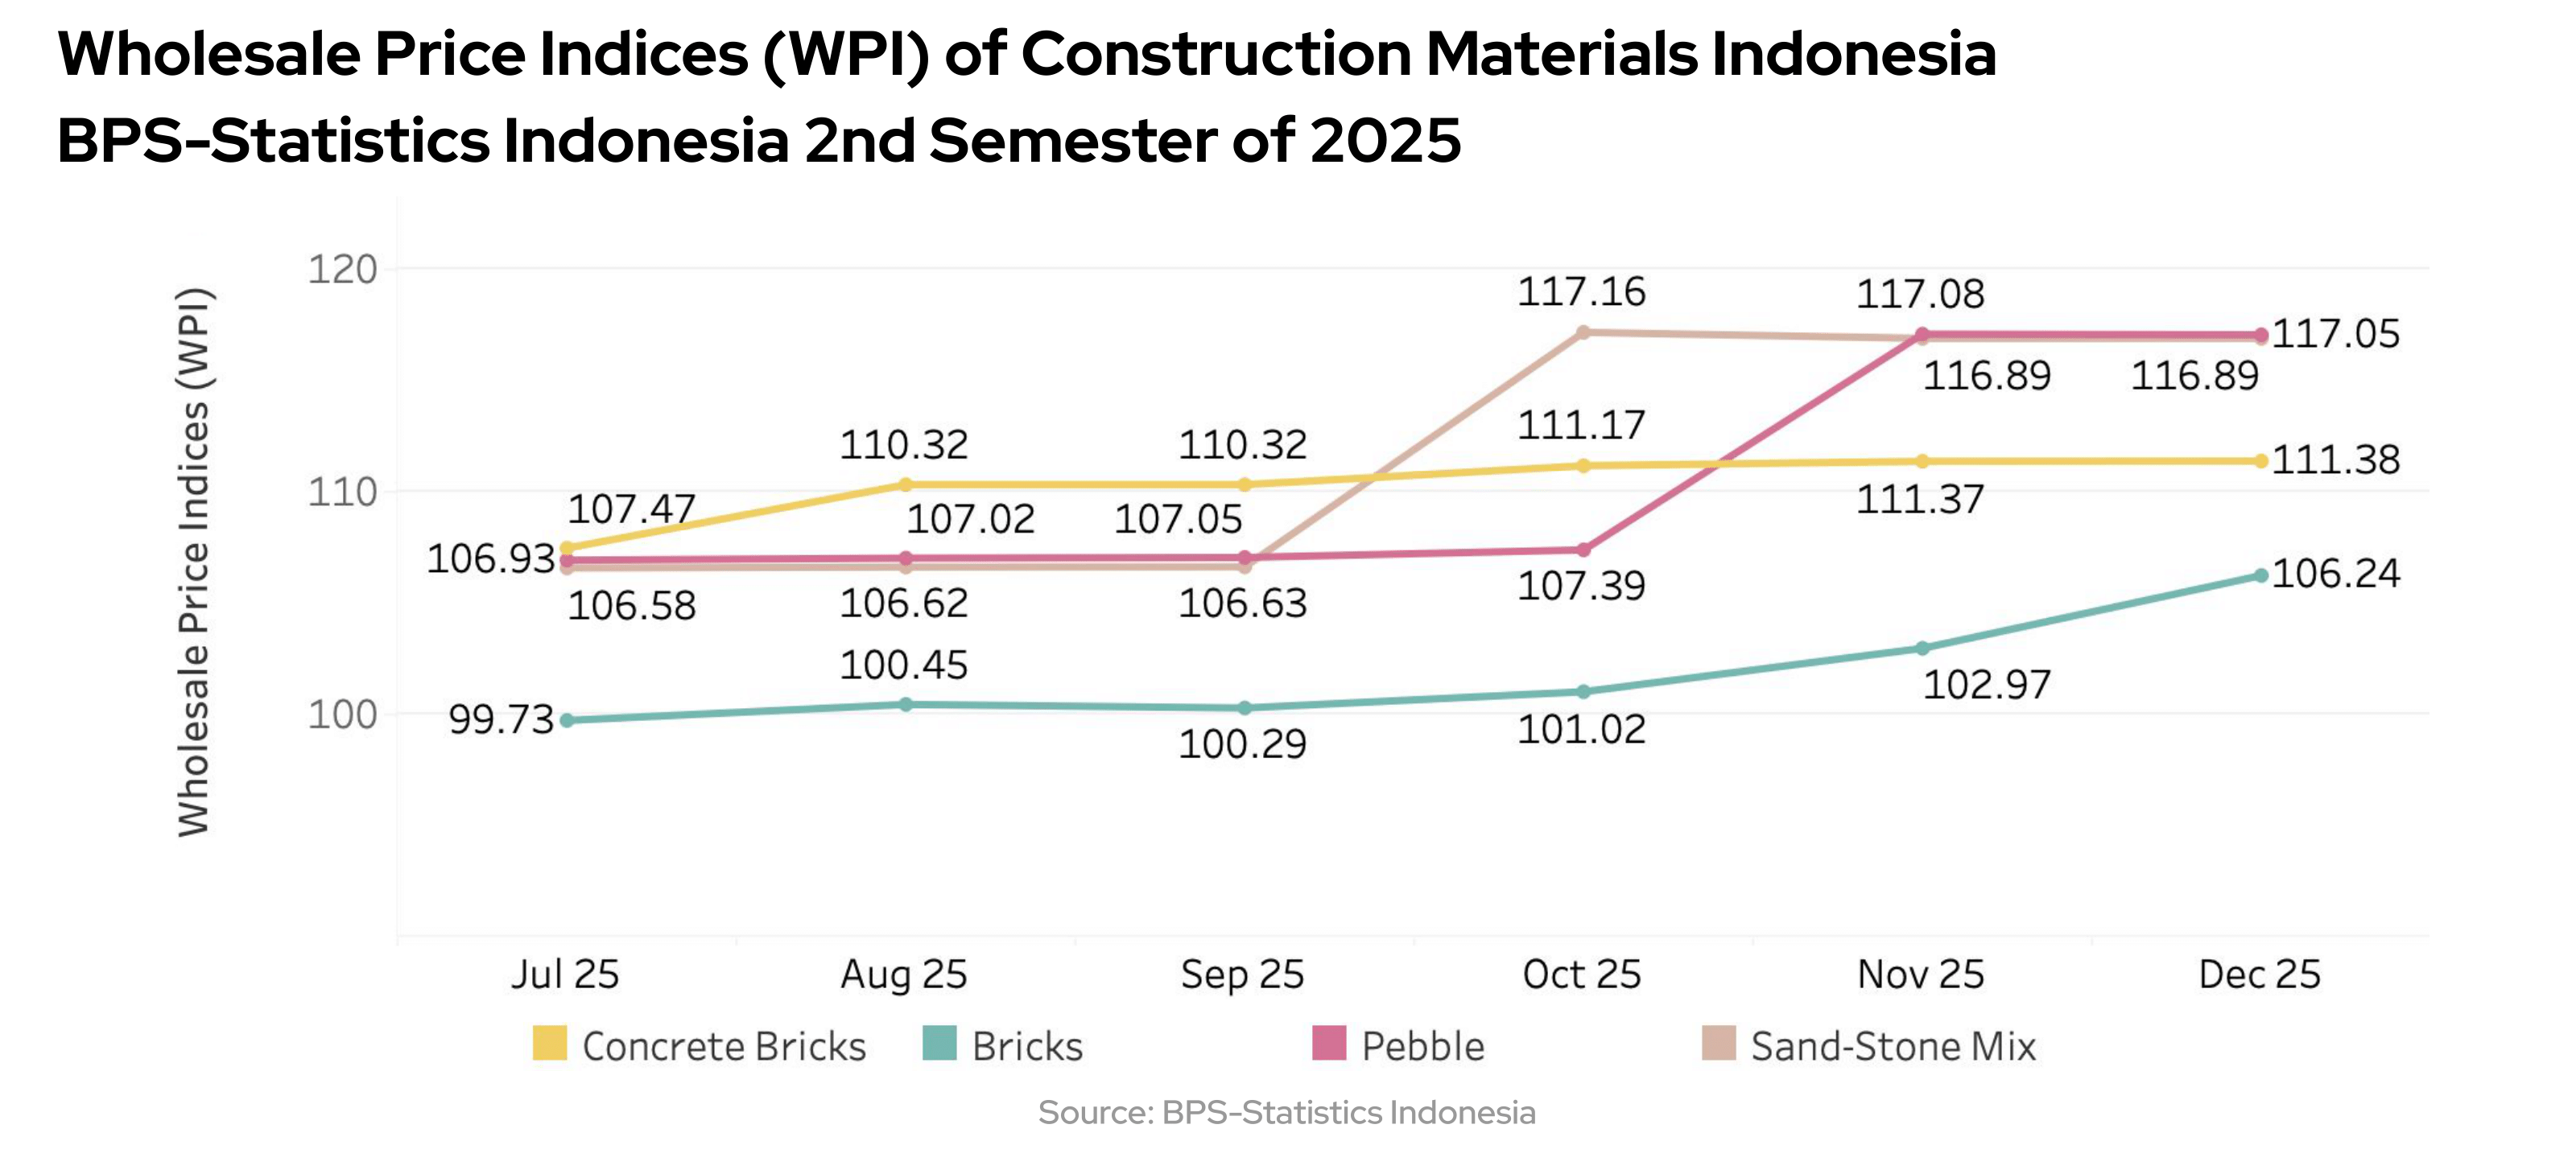
Increase in construction cost is not only driven by material imports following the US trade war, but also from shifts in domestic material costs. Data from the Wholesale Price Index (WPI) by the Central Bureau of Statistic (BPS) recorded an upward trend in prices for several key construction materials, such as concrete blocks, bricks, gravel, and pit run (sand and stone mix) during the 2nd semester of 2025.

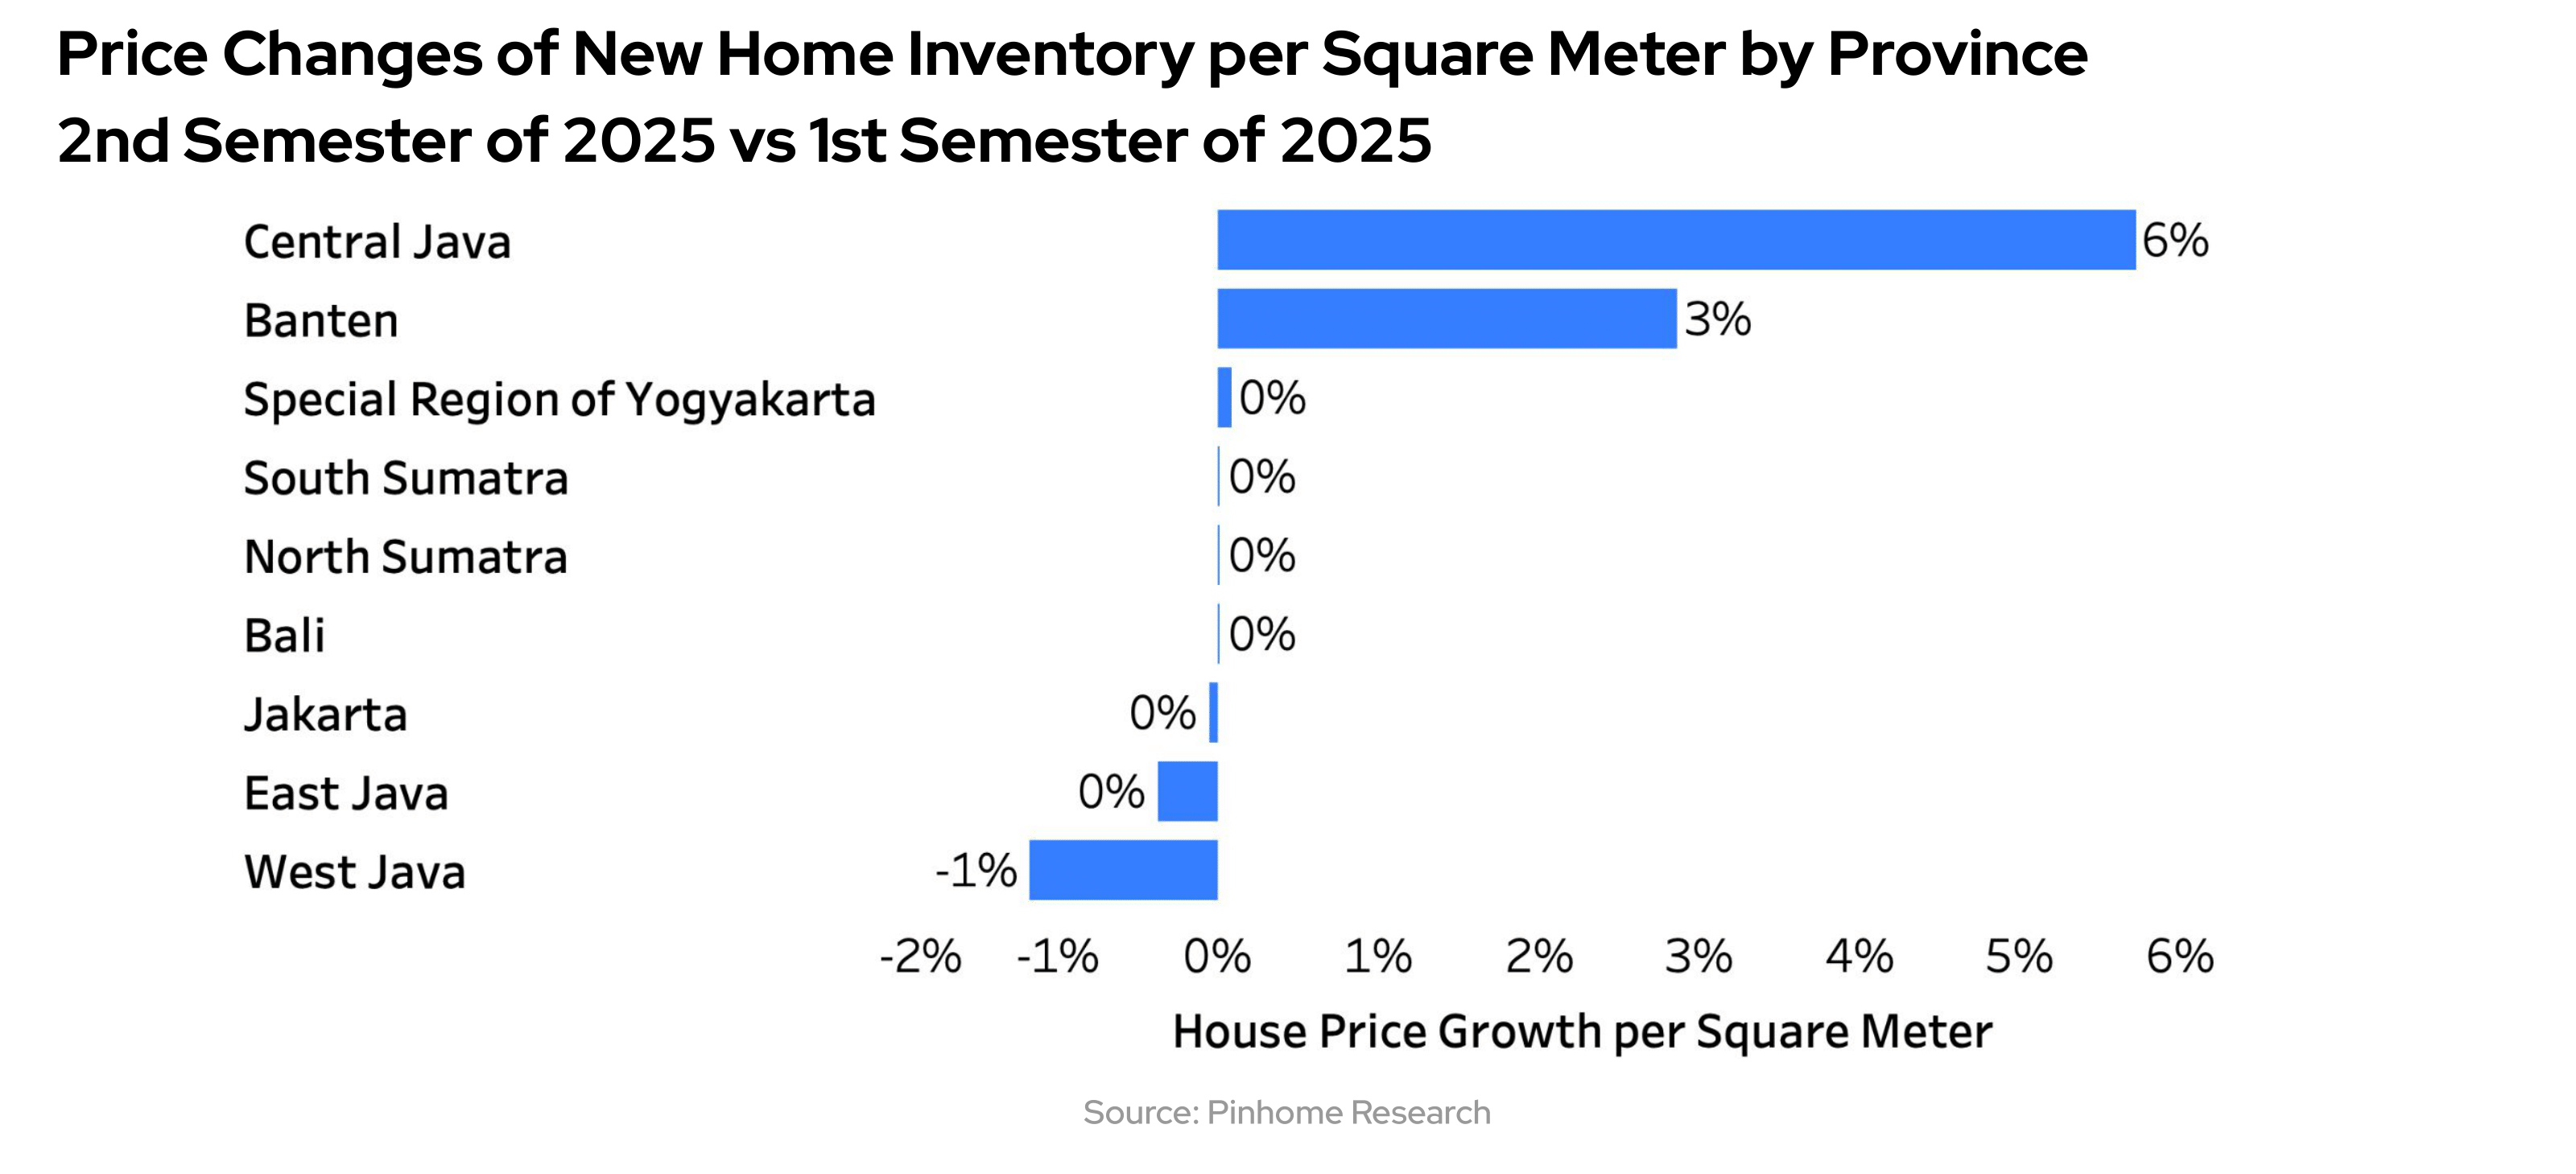
However, increasing material cost is not yet fully reflected in property price. Our internal data shows that new house prices per square meter remain stable in most provinces as developers choose to absorb rising construction costs to maintain market absorption and sales volume. Cost pressures began to appear across several regions in Java in the 2nd semester of 2025, with price increases reaching +6% in Central Java and +3% in Banten. This trend signals that developer capacity to hold prices is reaching the limit, particularly in high demand areas. Current stability is predicted to be a transitional phase before prices are adjusted gradually for project launches in 2026. This condition provides a time window for consumers to secure relatively low prices before the impact from increase in construction price is applied fully nationwide.
Spike in Secondary House Inventory as Liquidity Needs Rise
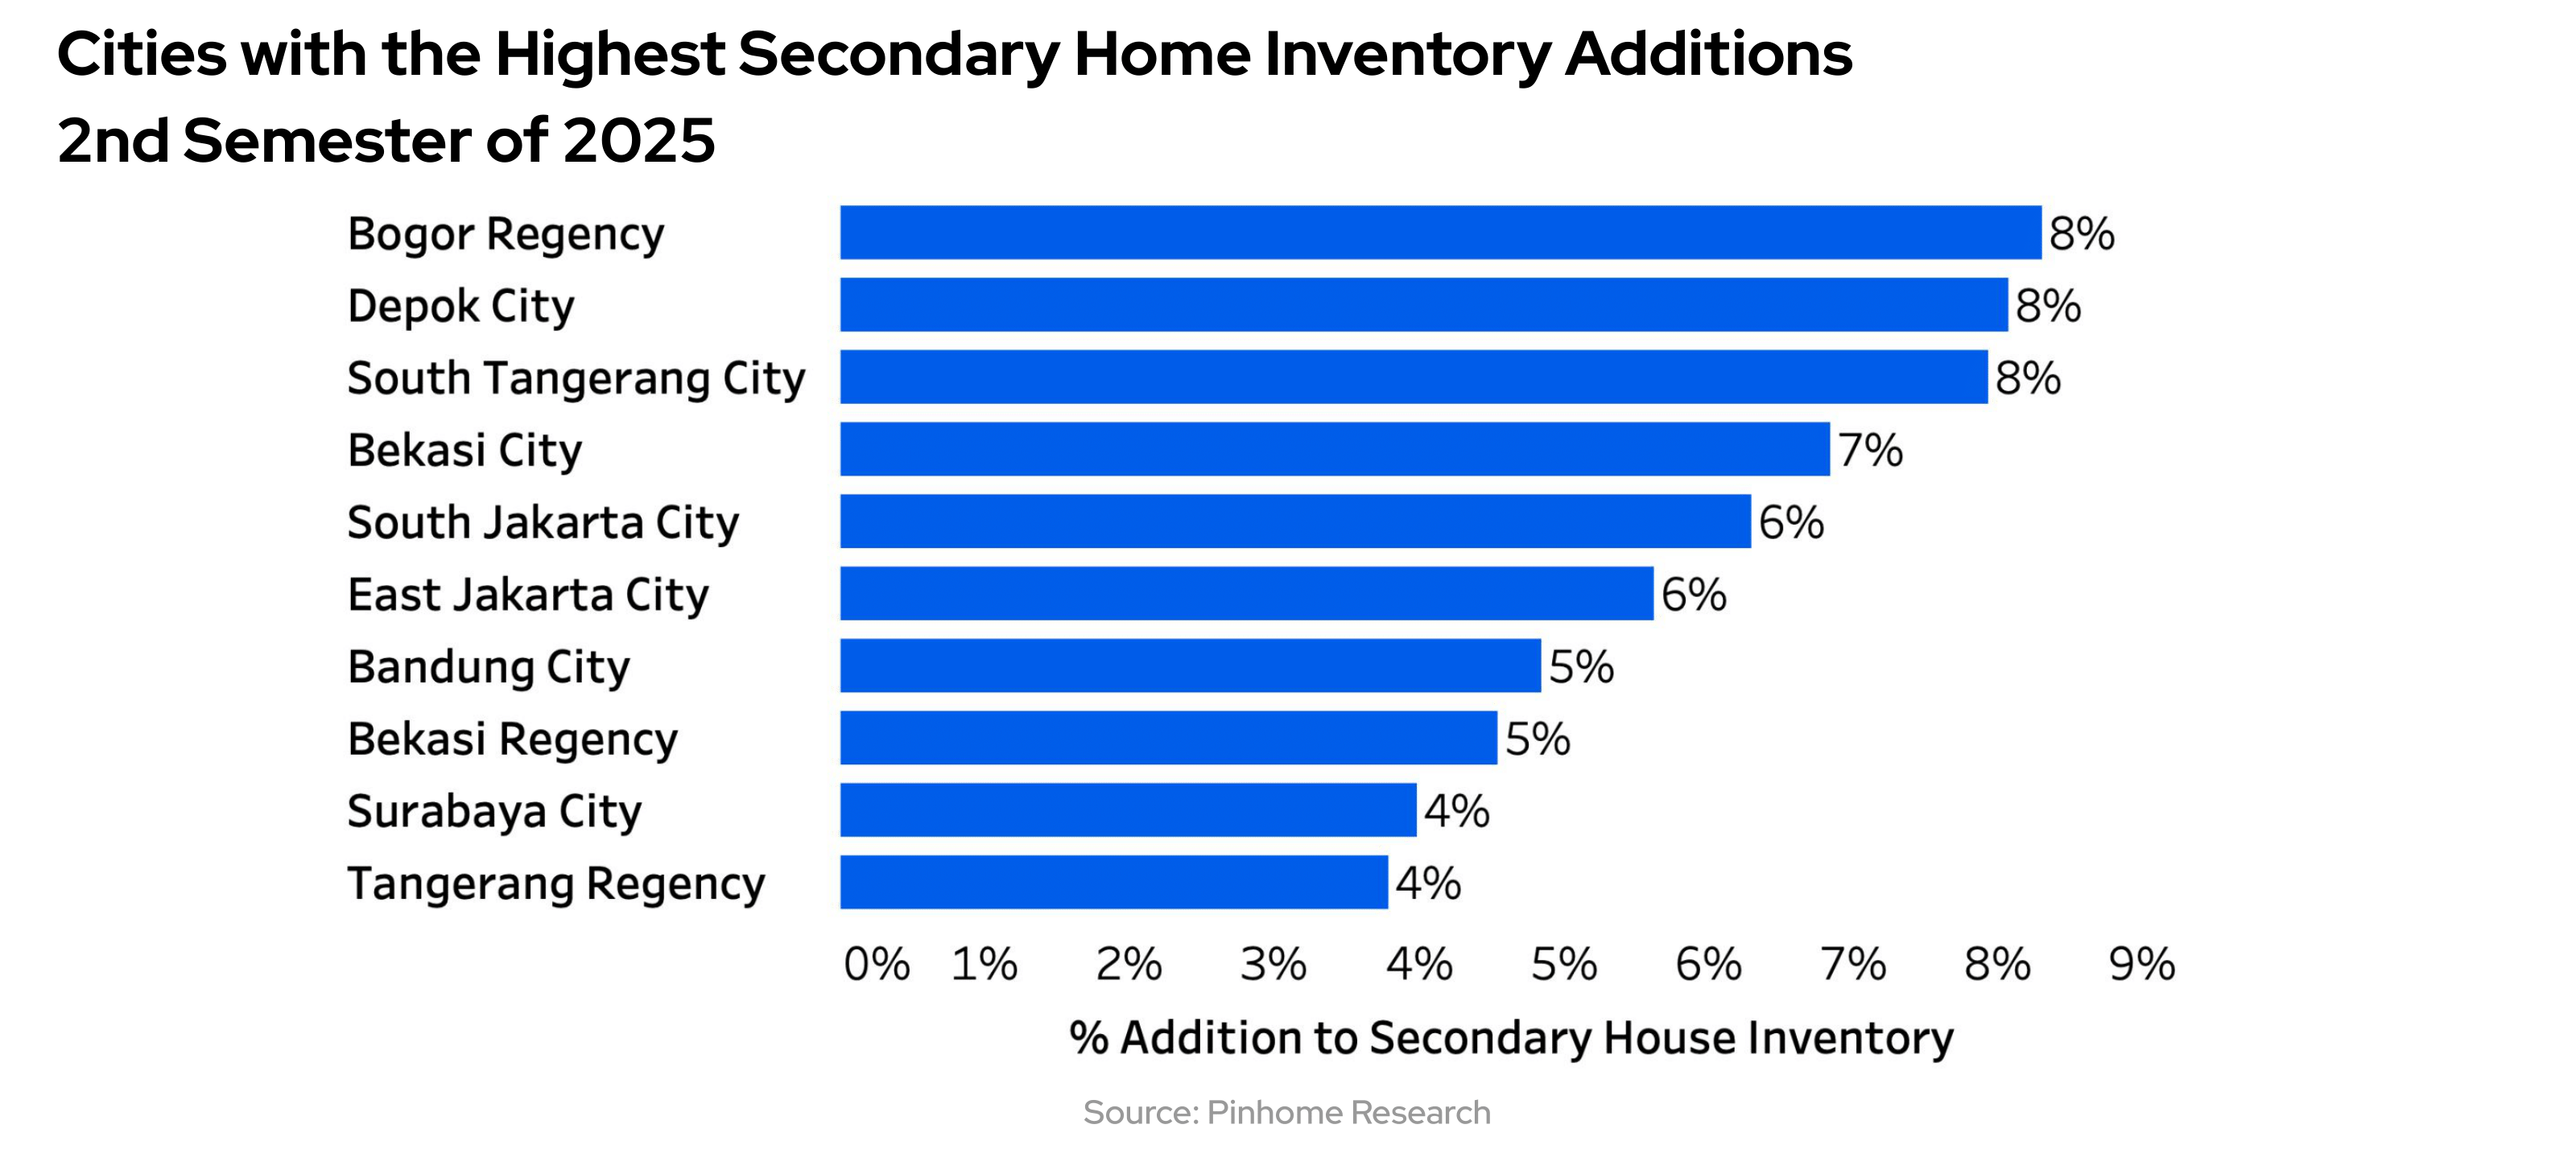
In contrast to the primary house market, the secondary house market recorded a consistent increase in inventory growth. Our internal data records that the average monthly growth of secondary housing inventory additions reached 5% throughout the 2nd semester of 2025.
This increase is driven by economic pressure. Wave of layoffs across various companies and rising cost of living forcing many asset property owners-particularly investors and second homeowners–to let go of their assets to get cash. Property that has been used as a long term investment instrument, is now converted into emergency fund resources to maintain household cash flow.
The most significant increase in secondary house inventory is concentrated in Jakarta’s satellite areas, specifically Bogor Regency, Depok, and South Tangerang, with each contributing 8% to the total growth. This concentration reflects the character of these regions as property investment hubs over the past few years.
The “Quick Sale” Inventory Trend is Suppressing Market Price
In addition to the increase in total inventory, the characteristic of inventory entering the market also shows indication of liquidity pressure on property owners. Our internal data shows a growth of +15% from the average monthly growth of secondary housing inventory in the 2nd semester of 2025 in listings tagged with urgency labels, such as 'BU' (Needs Cash), 'Quick Sale,' or offers below market price.
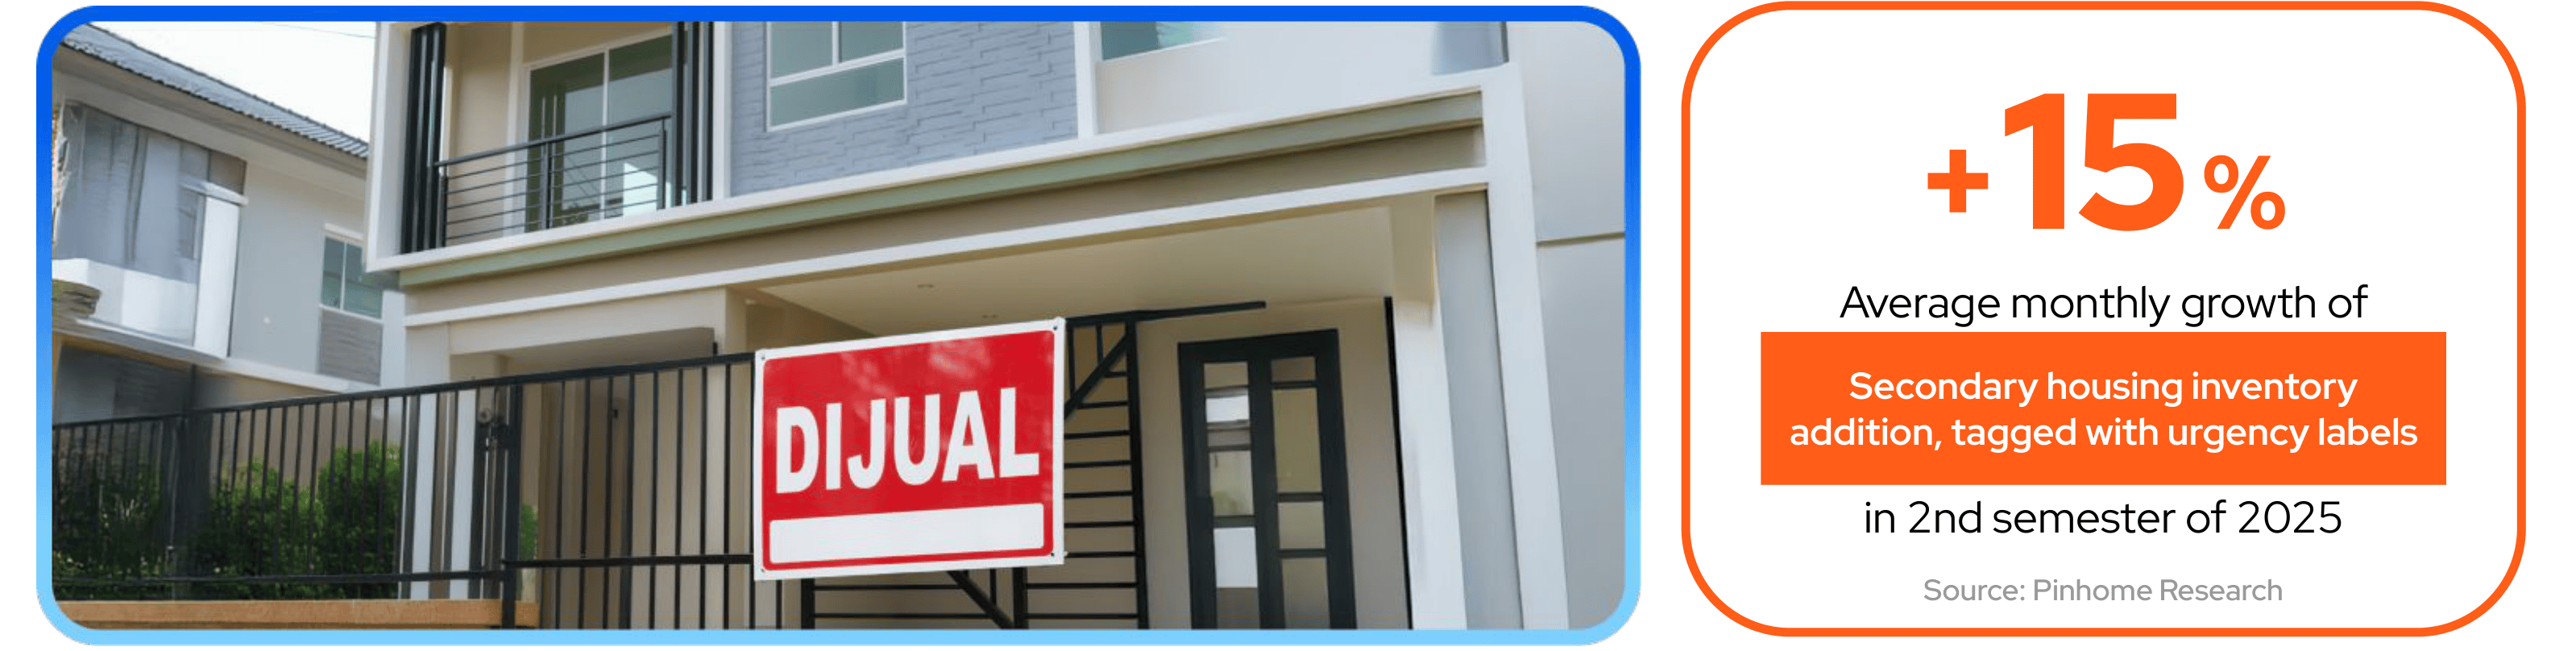
Inventory in this category is generally marketed at prices significantly below the median market price in their respective areas. The presence of these discounted listings creates a new, more competitive price benchmark. As a result, other property owners selling at standard rates are forced to adjust or correct their prices to ensure their assets remain attractive to buyers. This condition has triggered a gradual decline in average market prices across various densely populated areas.
Although it puts pressure on the seller side, this phenomenon actually creates a highly advantageous momentum for strategic buyers and investors to secure quality assets at their lowest price points. This price correction is viewed as a transition phase toward a more liquid market, which will serve as the foundation for healthier property value growth in the future.

Demand Dynamics and Consumer Confidence in the Middle of Social Turbulence
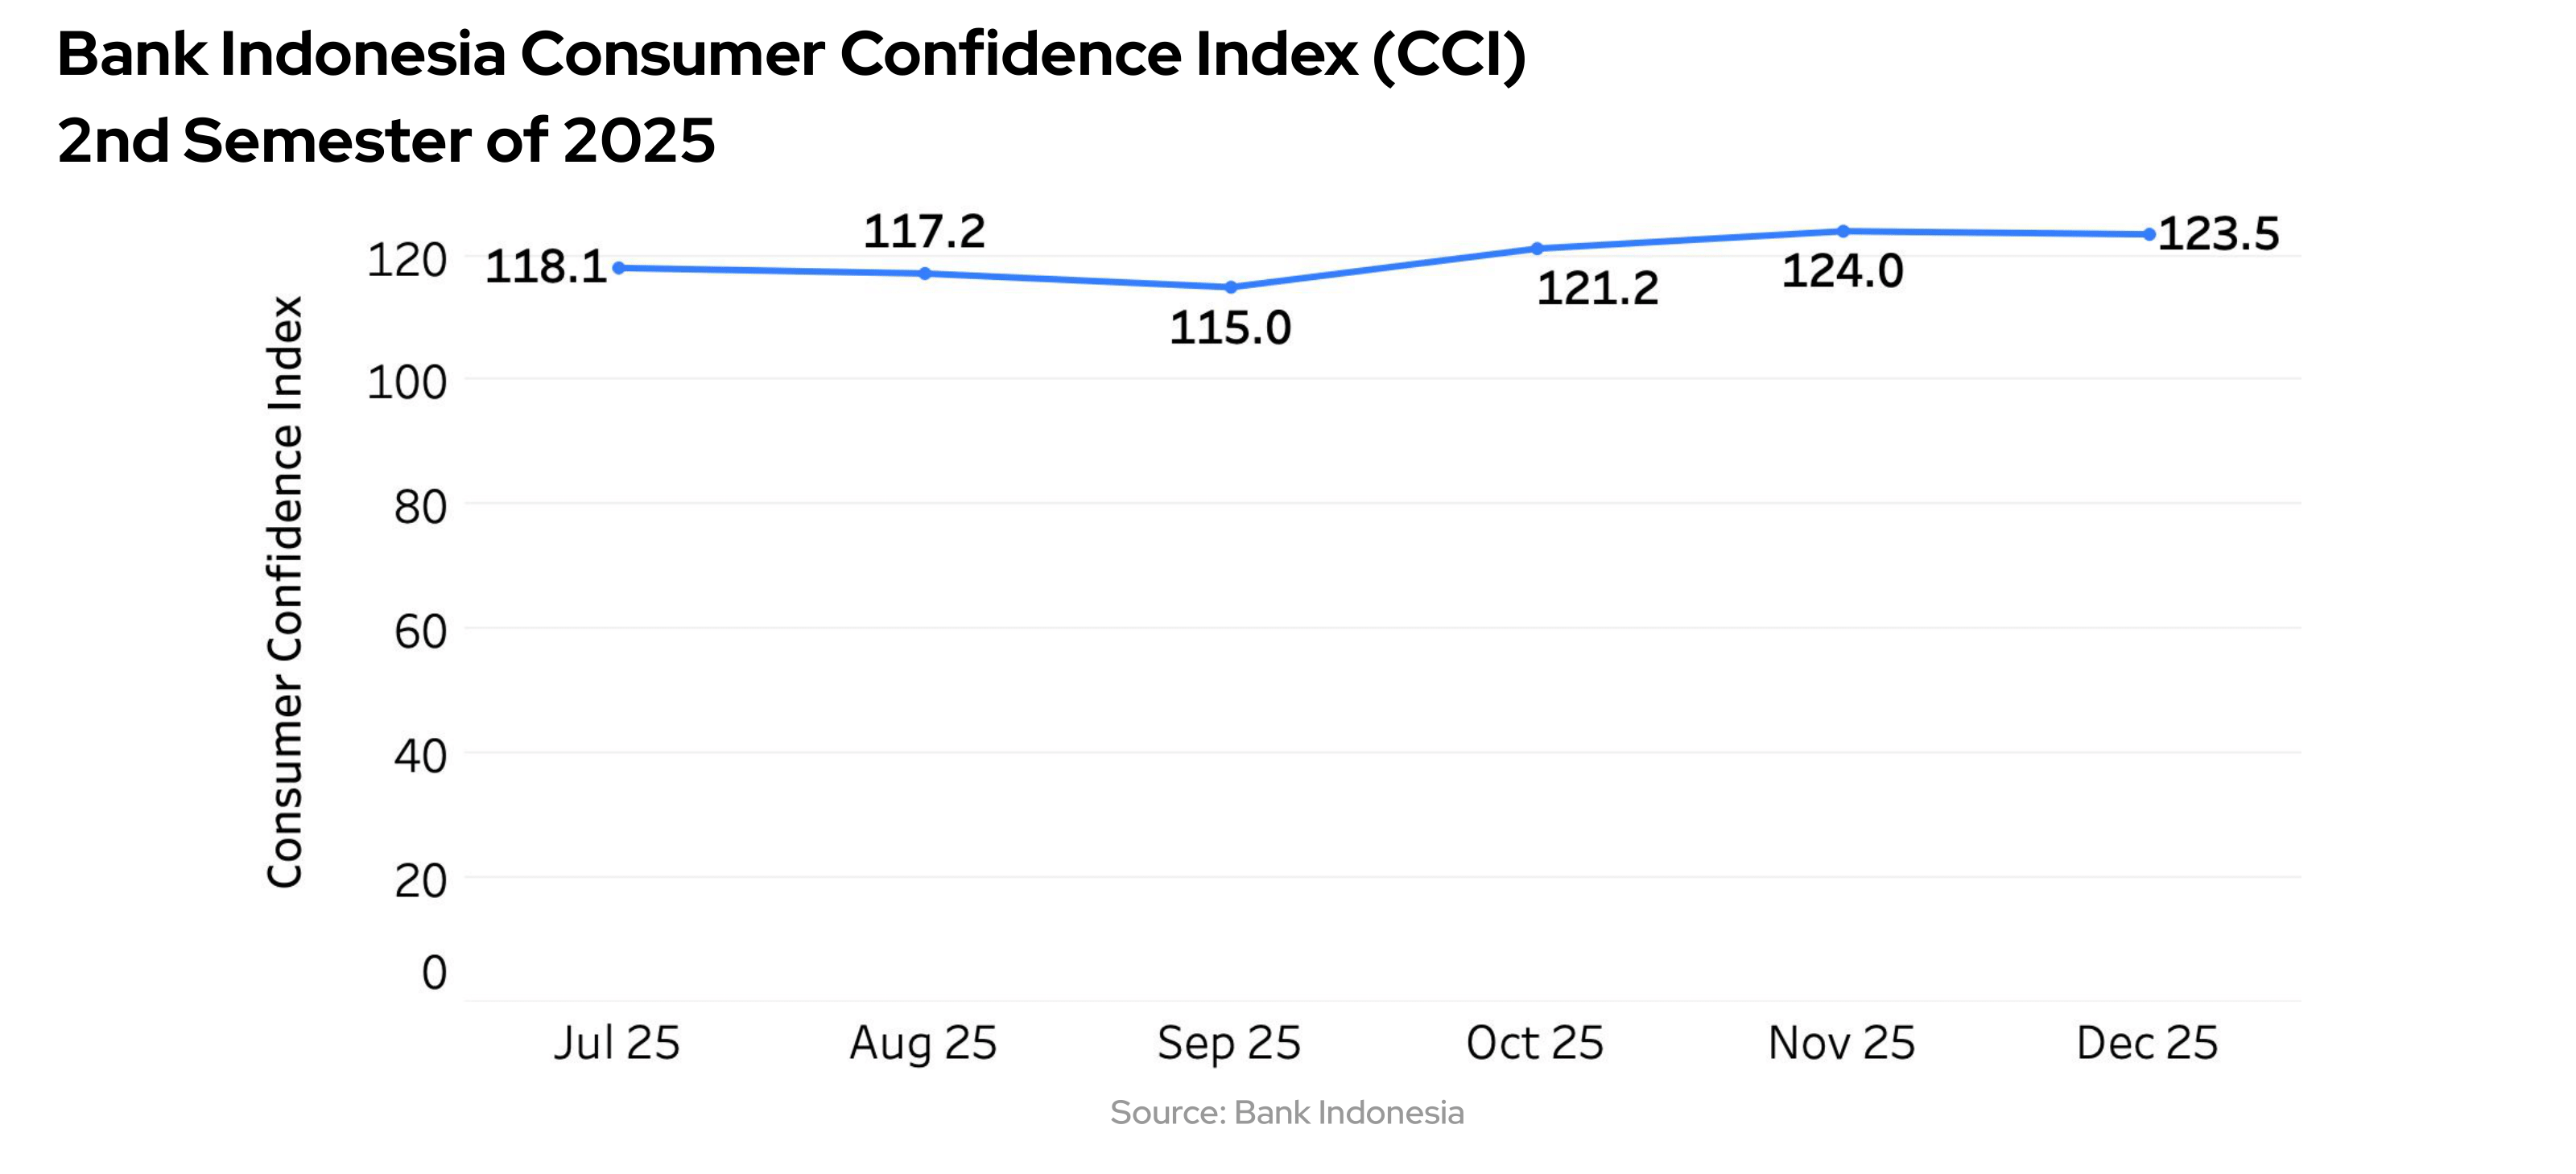
Social turbulence that occurred in August to September 2025 is clearly reflected in changes in consumer behavior. Based on Bank Indonesia’s Consumer Confidence Index (ICC), there has been a downward trend in public confidence, declining from a level of 118.1 in July to 115.0 in September. This is the lowest point throughout 2025, which reflects public concern about security and economic stability during this period.
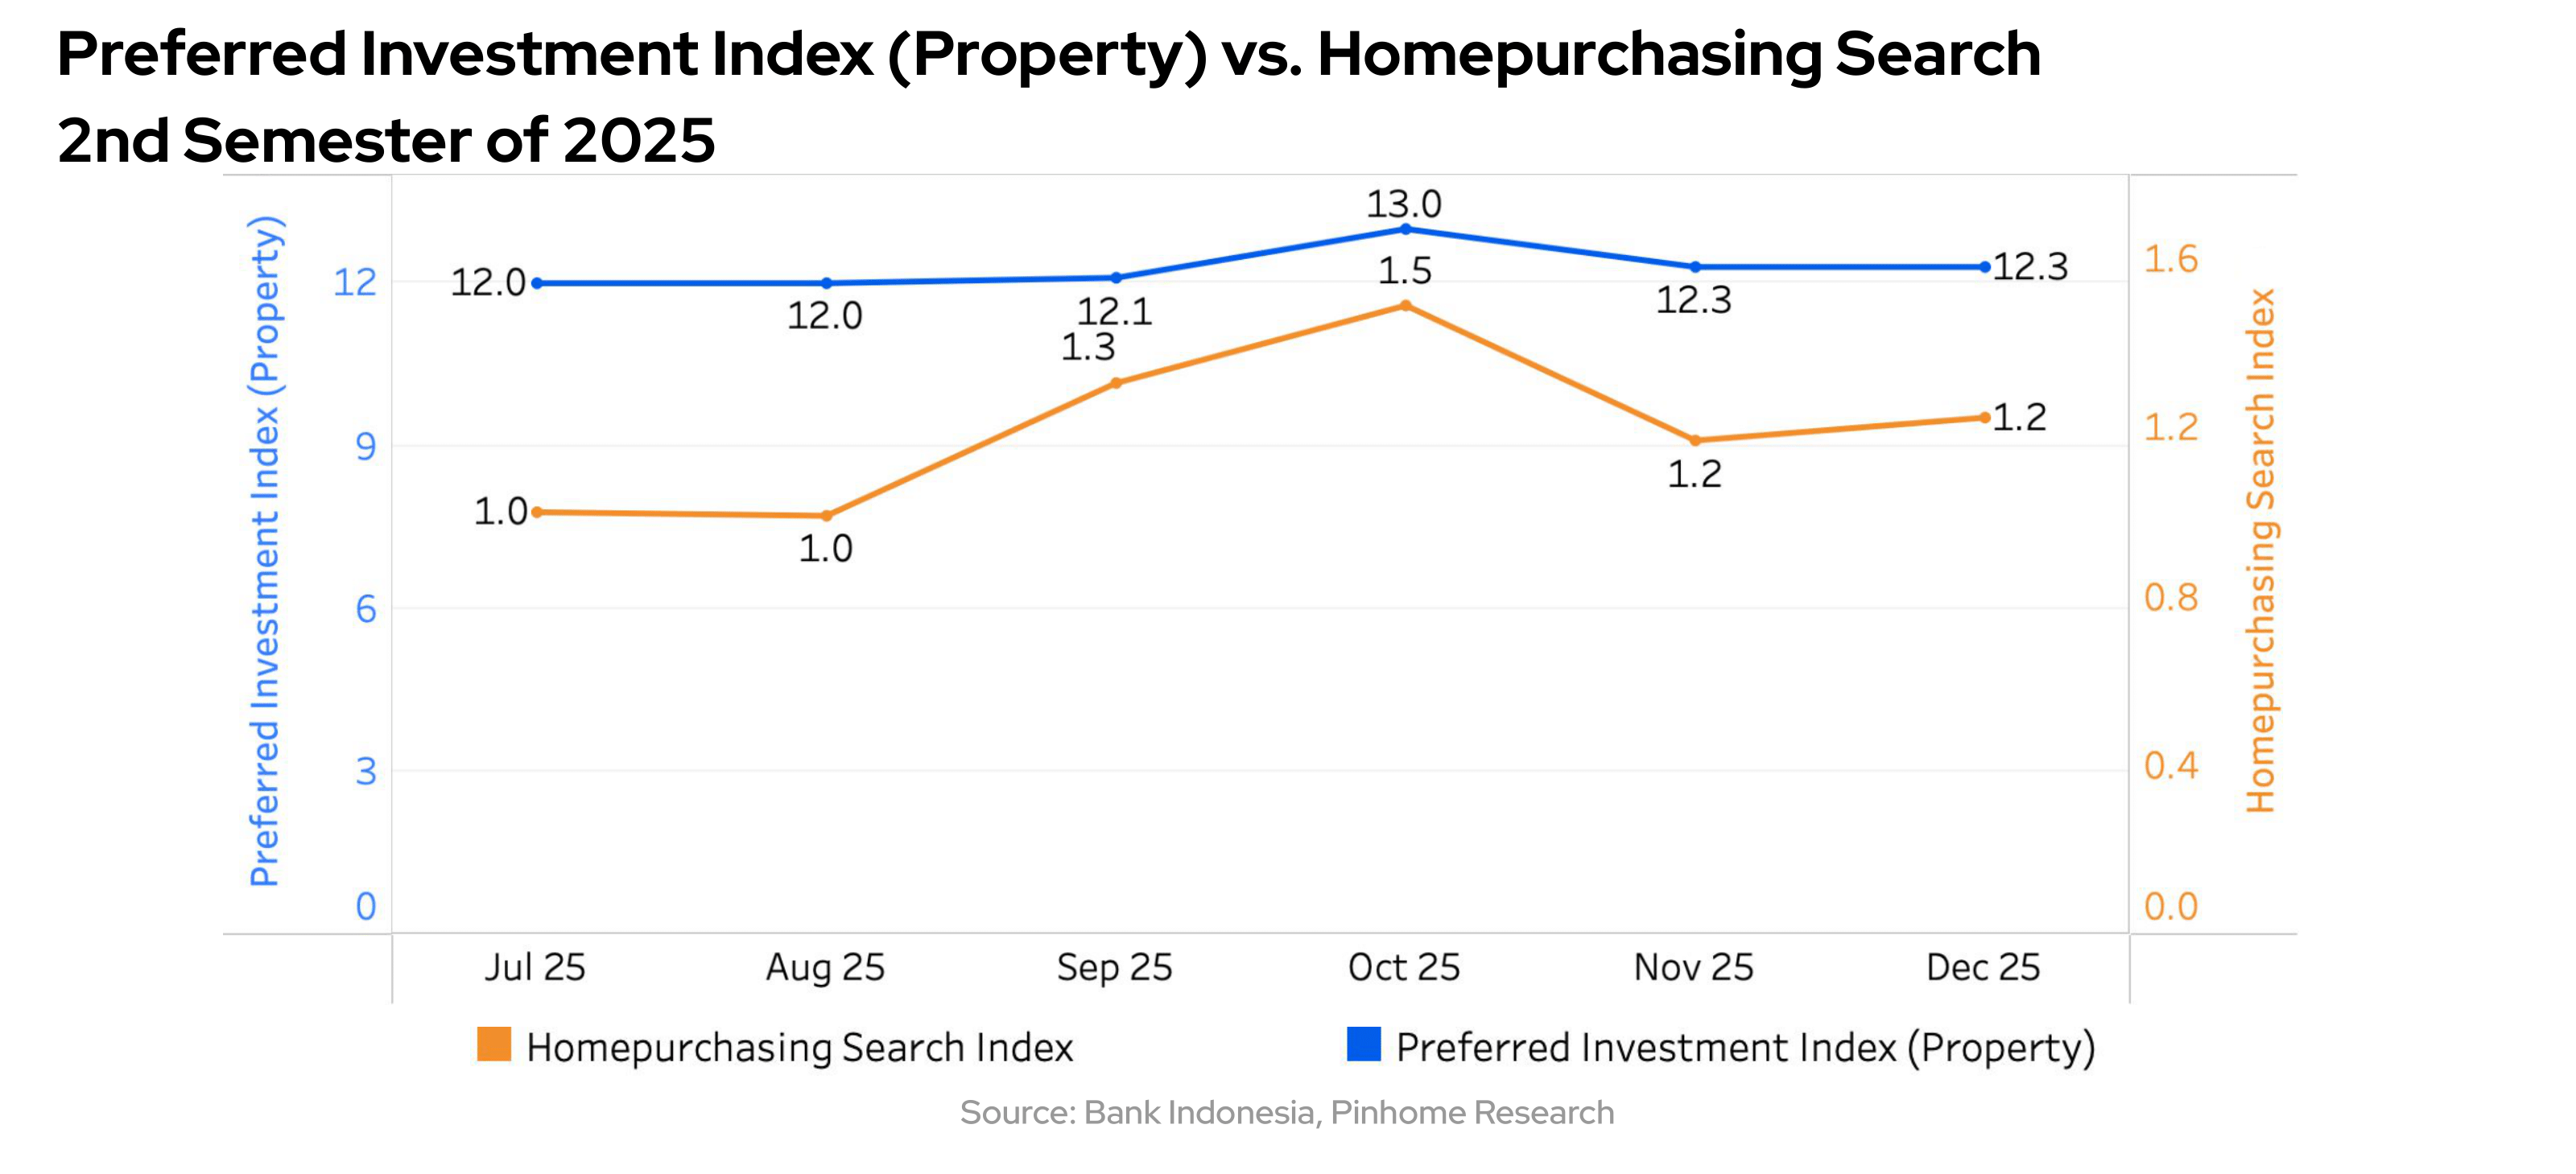
Nevertheless, Bank Indonesia's consumer survey regarding preferred investment choices for the next 12 months shows that interest in the property sector remains relatively resilient, even beginning to strengthen following that period of pressure. This preference aligns with our internal data, which recorded a slight decline of -1% in month-on-month homepurchasing search demand in August 2025. Such conditions indicate a 'wait and see' approach from consumers, who tended to postpone major decisions amid the unstable social situation at that time.
Entering the month September 2025, when the situation is starting to be more conducive and economic activities are gradually returning to normal, homepurchasing search surged significantly by +32% month-on-month. This increase is mainly driven by growing interest in secondary houses, which are generally perceived as more affordable and ready to move-in amidst consumer caution in managing finances.
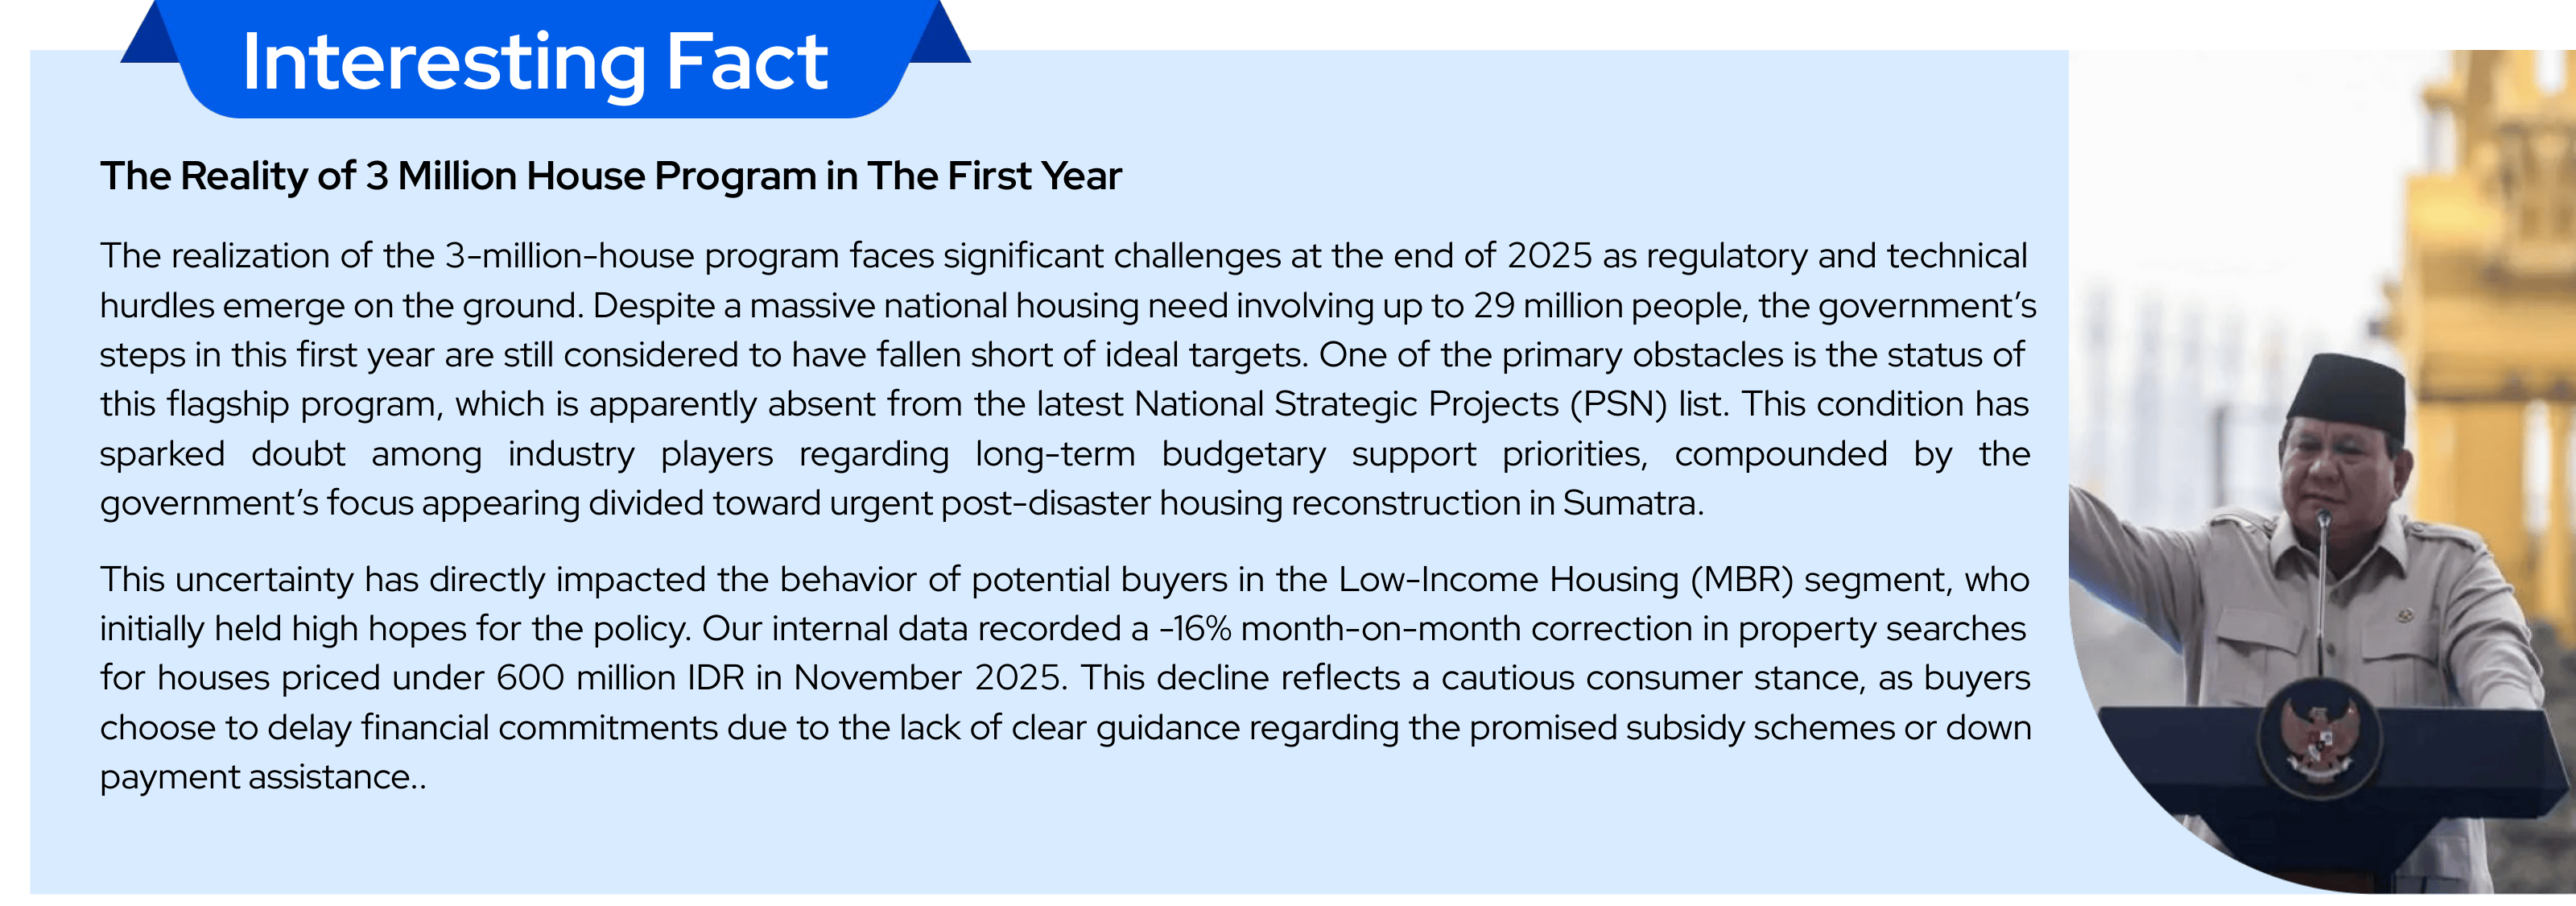
The strengthening of consumer confidence became more apparent in October 2025. Bank Indonesia’s Preferred Investment Choice Index for the property sector rose to 13.0, reflecting an improved perception of property as an investment option. However, this sentiment did not fully persist. In November 2025, the index retreated to 12.3 as consumer caution resurfaced toward the end of the year. This pattern was consistently reflected in Pinhome’s internal data, where property searches saw a month-on-month correction of -21% during the same period.
Closing out 2025, Bank Indonesia’s Preferred Investment Choice Index remained stable in December, unchanged from the previous month. On the other hand, homepurchasing search activity on the Pinhome platform actually began to show signals of recovery, with a growth of +5% on a monthly basis. This movement indicates that while consumer investment preferences tended to stagnate, the appetite to re-enter the property market began to form, driven by expectations of more stable economic conditions at the start of the following year.
A Shift Priority Towards House Rentals
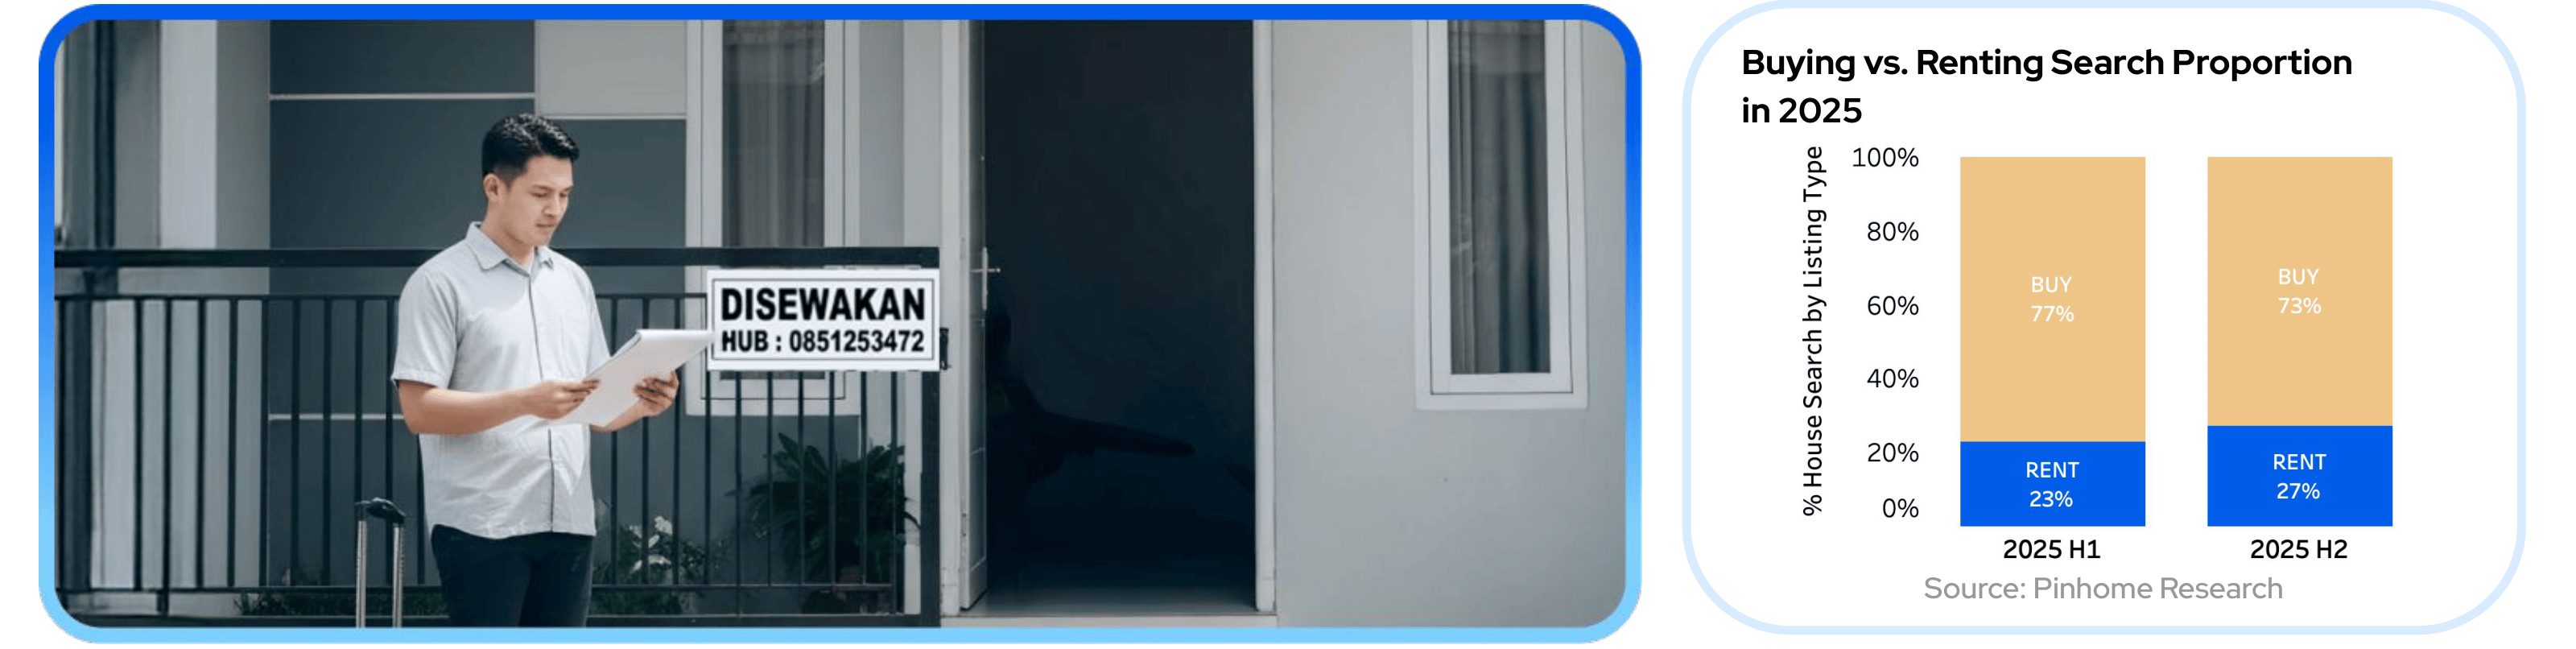
The postponement in property purchase commitments occurring at the end of 2025 has been followed by a shift in interest toward the rental market. This phenomenon is reflected in the changing proportion of "buy" vs. "rent" searches on our platform. Overall, the proportion of rental searches showed an increase from 23% in H1 2025 to 27% in H2 2025. This indicates that property seekers are beginning to prioritize short-term financial flexibility over committing to long-term mortgage obligations amidst a dynamic economic landscape.
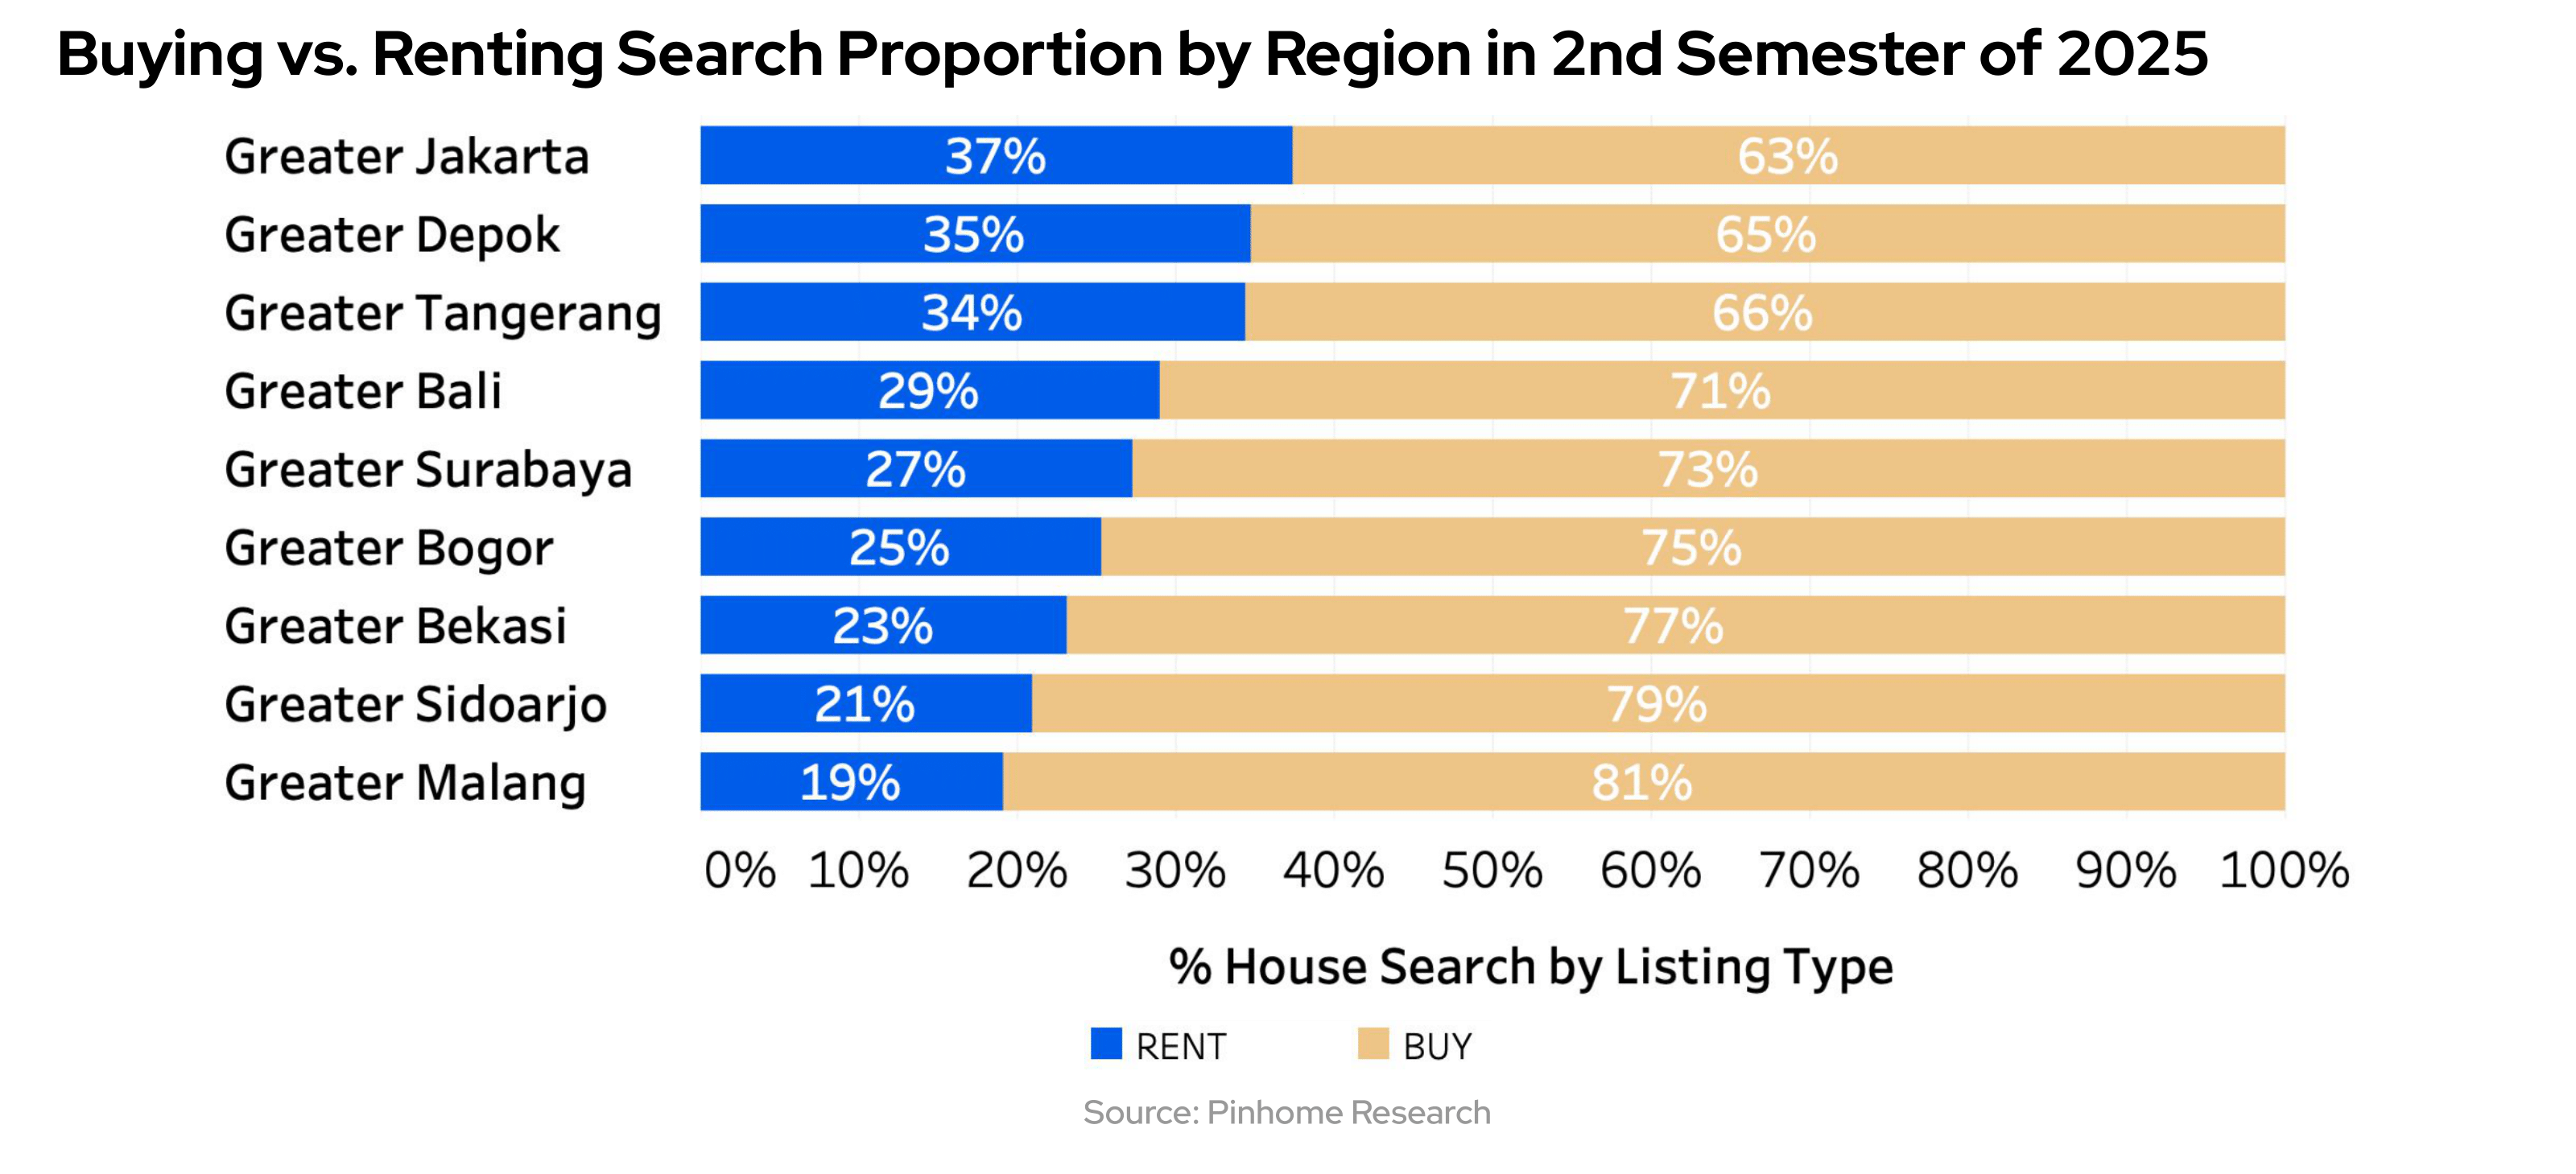
This pattern is also consistently reflected at the city level. Cities with higher costs of living and greater economic activity show a relatively larger share of rental searches. Greater Jakarta recorded the highest proportion of rental searches within the Jabodetabek region, while Surabaya displayed a similar trend as the primary economic hub of East Java. These findings reinforce indications that the shift toward the rental market is primarily driven by dynamics in major urban cities.
Contrast in Property Demand Between Industrial and Residential Areas
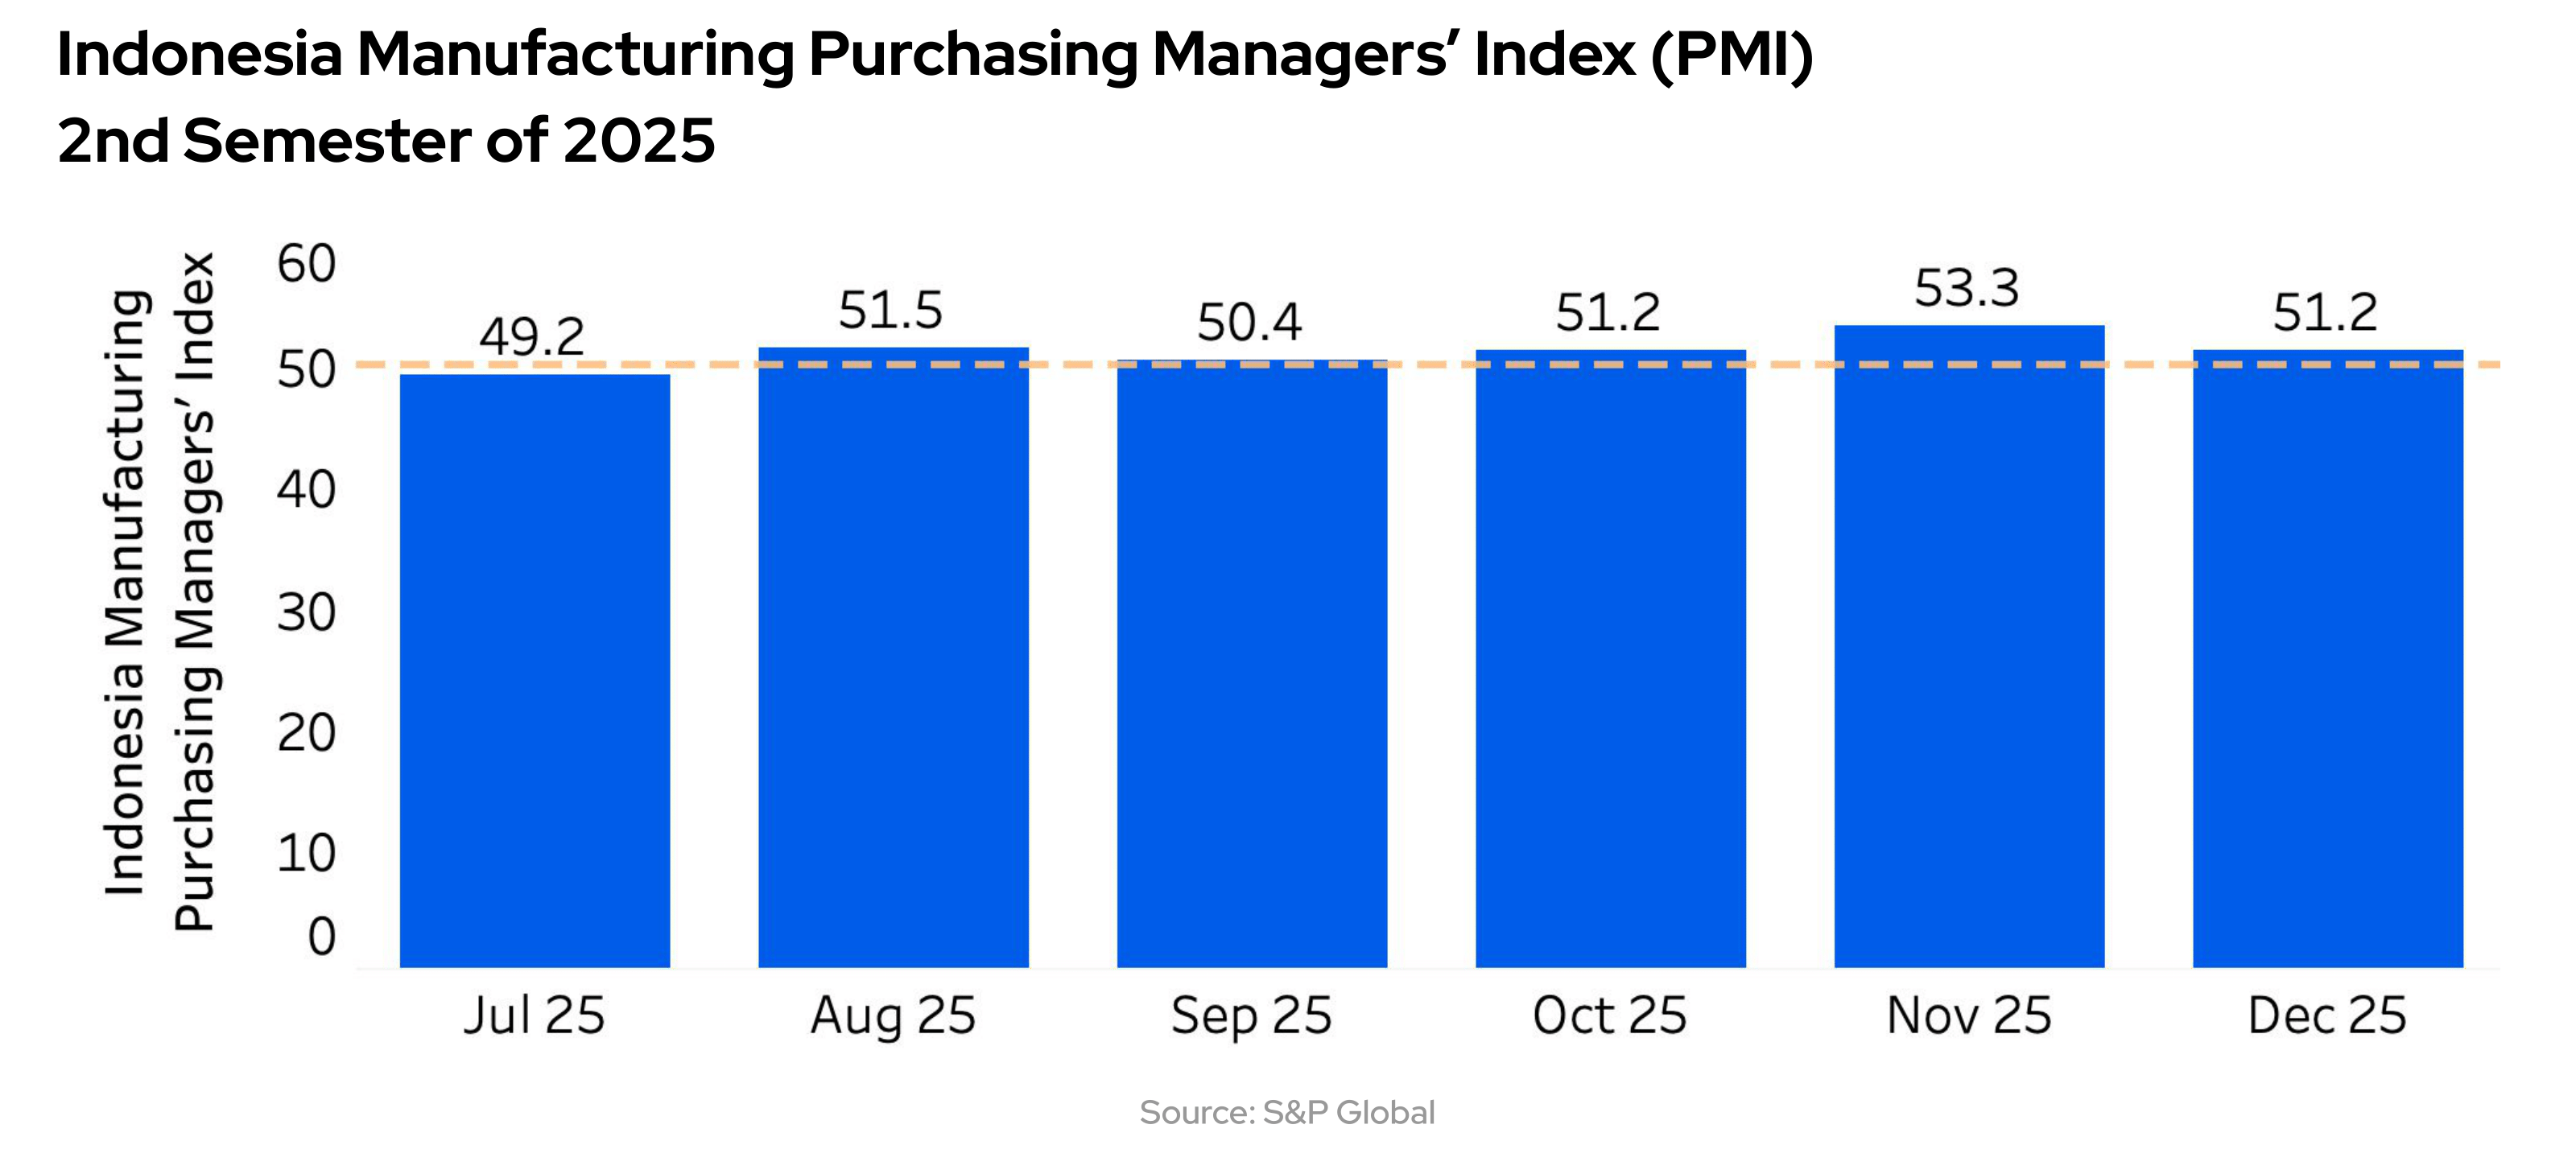
Closing the year 2025, Indonesia's manufacturing industry continues to show a positive trend. The Manufacturing Purchasing Managers’ Index (PMI) for December 2025 was recorded at 51.2, remaining above the expansion threshold. This marks an expansionary phase that has lasted for five consecutive months. In line with these conditions, homepurchasing search data for the 2nd semester of 2025 shows an increase in interest within industrial areas, reflecting the resilience of the national manufacturing sector.
Our internal data shows that major industrial zones in the Bekasi Regency are experiencing strong demand growth. All districts in the Cikarang area, which serves as the hub for factory operations, recorded positive growth of 16%. A similar trend occurred in the industrial centers of Karawang Regency, with growth in Cikampek at 7% and Klari at 4%. In contrast, property demand in the residential areas of Bekasi Regency which generally function as commuter zones has undergone a correction. The decline in homepurchasing searches in the 2nd semester of 2025 compared to the previous semester was recorded in Tambun (-22%), Cibitung (-9%), and Setu (-7%).
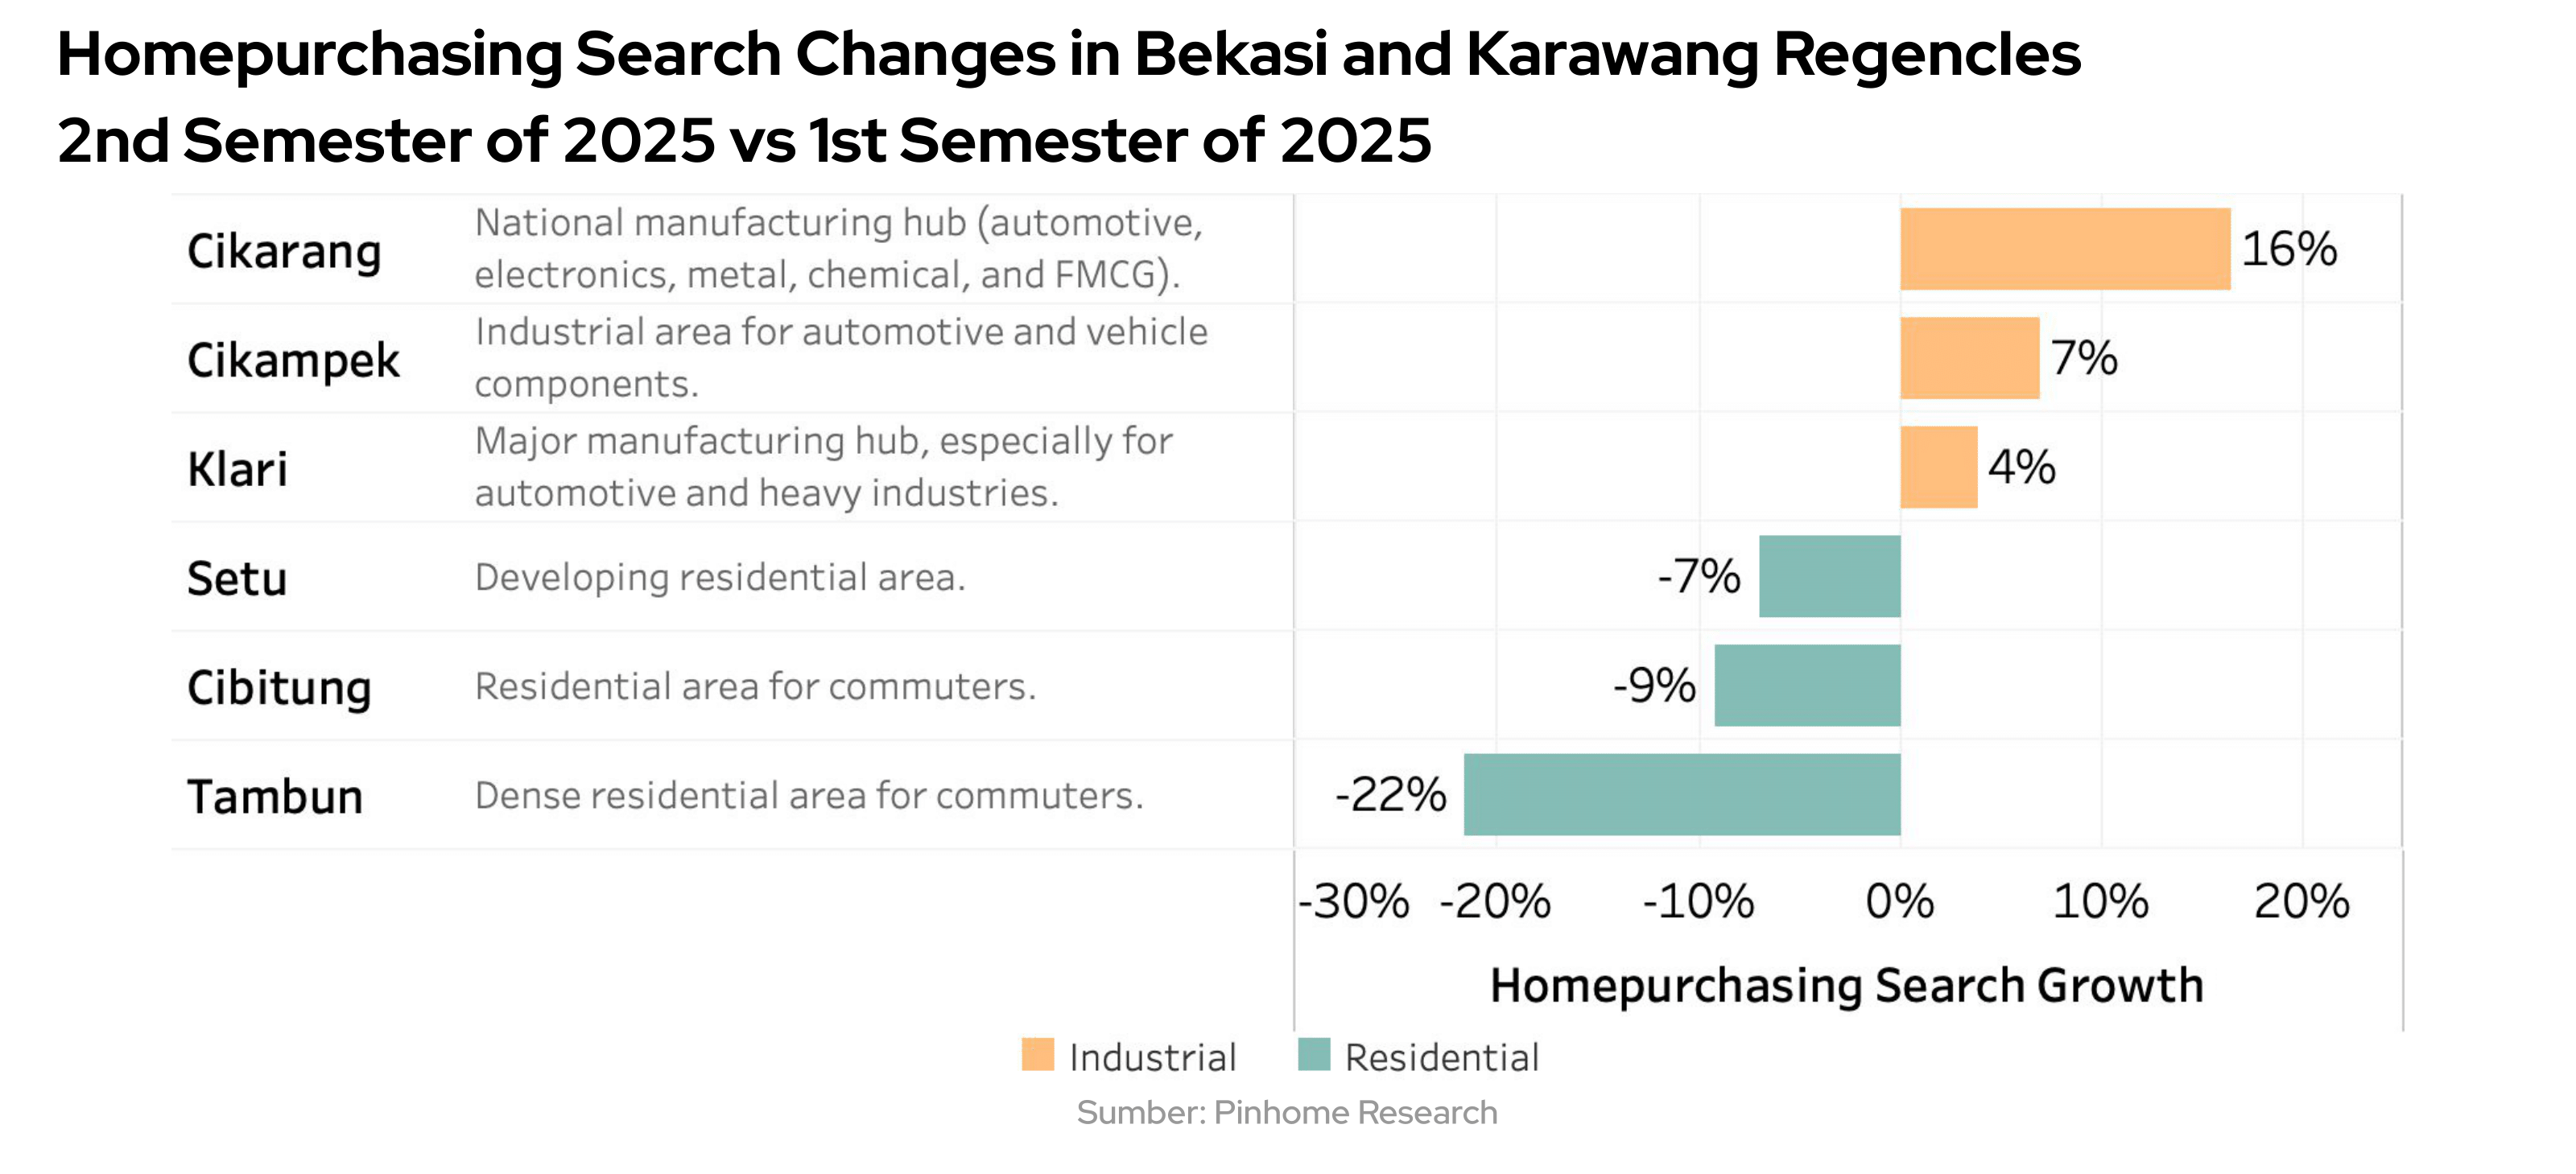
This divergence in trends indicates that property search interest is increasingly concentrated in industrial areas. Robust manufacturing activity continues to drive demand for housing near employment hubs, while non-industrial residential areas are seeing an adjustment in demand. These conditions suggest that industrial sector dynamics remain a crucial factor in shaping property demand patterns across the Bekasi and Karawang regions.

The Phenomenon of Tenor Stretching as a Banking Affordability Strategy
The increase in property prices, which has been disproportionate to income growth, has forced the banking industry to aggressively adjust its financing strategies. To ensure that monthly installments remain secure and aligned with customers' financial capabilities, banks are now shifting toward policies that extend loan durations. Currently, a 20 to 30-year tenor is no longer just an option for customers, but rather a primary strategy for banks to increase credit approval rates by spreading the installment burden over a much longer period.
This move is clearly visible in the programs available at Pinhome that offer a minimum tenor of 20 years, aiming to target a broader segment of society so they can still afford monthly installments. On an annual basis, the availability of programs with a minimum tenor of 20 years recorded a 100% growth in the 2nd semester of 2025 compared to the same period in the previous year.
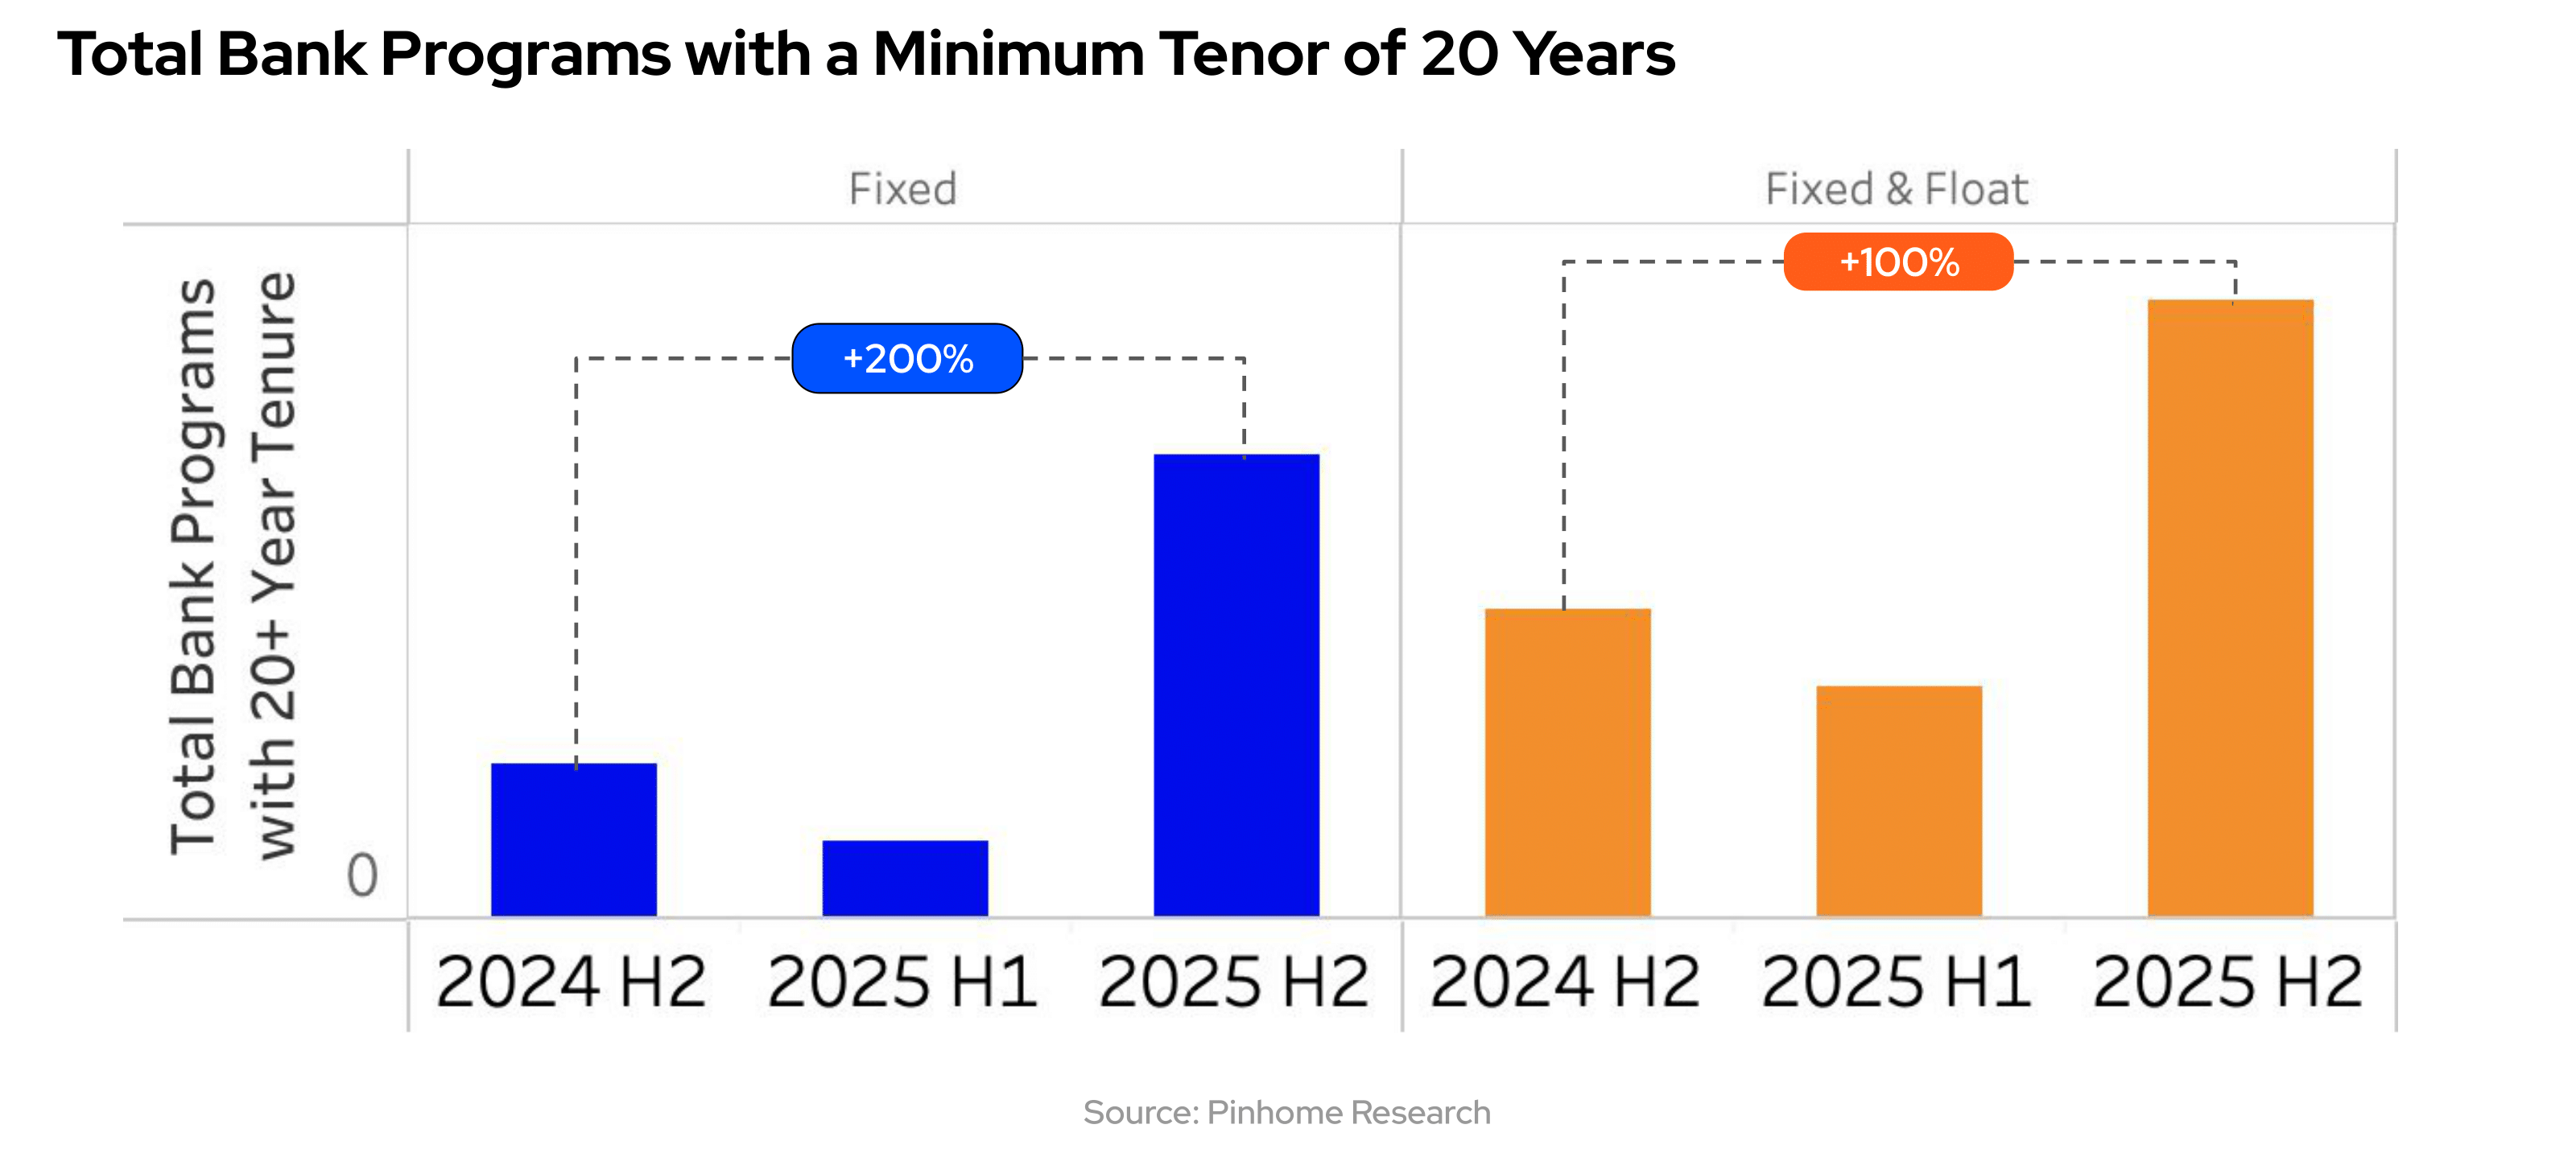
This acceleration is massively driven by an increase in fixed-rate options for long tenors. In the 2nd semester of 2025, the number of fixed-rate installment programs with a minimum tenor of 20 years grew by 200% on an annual basis. This indicates that banks are not only offering longer durations but are also attempting to provide installment certainty amidst economic uncertainty.
Technically, this trend extends the duration of the debtor's financial obligations to cover a significant portion of their productive years. From a banking perspective, this tenor-stretching strategy serves to secure stable and sustainable interest income over a longer period.
Decrease in Primary Mortgage Ticket Size: A Realistic Customer Strategy
In addition to the tendency to choose mortgages with longer tenors, there is a shift in the credit limit (plafon) values applied for by customers. Potential buyers are now acting more conservatively by selecting property units that strictly align with their financial capabilities, rather than forcing themselves to acquire high-value assets that risk straining future cash flows.
Internal data reflects this cautious stance through the movement of the median credit limit. Although there was a slight increase of 3% in the 1st semester of 2025 compared to the 2nd semester of 2024, that trend reversed significantly in the second half of 2025. The median mortgage application value in the 2nd semester of 2025 recorded a decrease of nearly -17% compared to the previous semester, or a correction of approximately -14% on an annual basis.
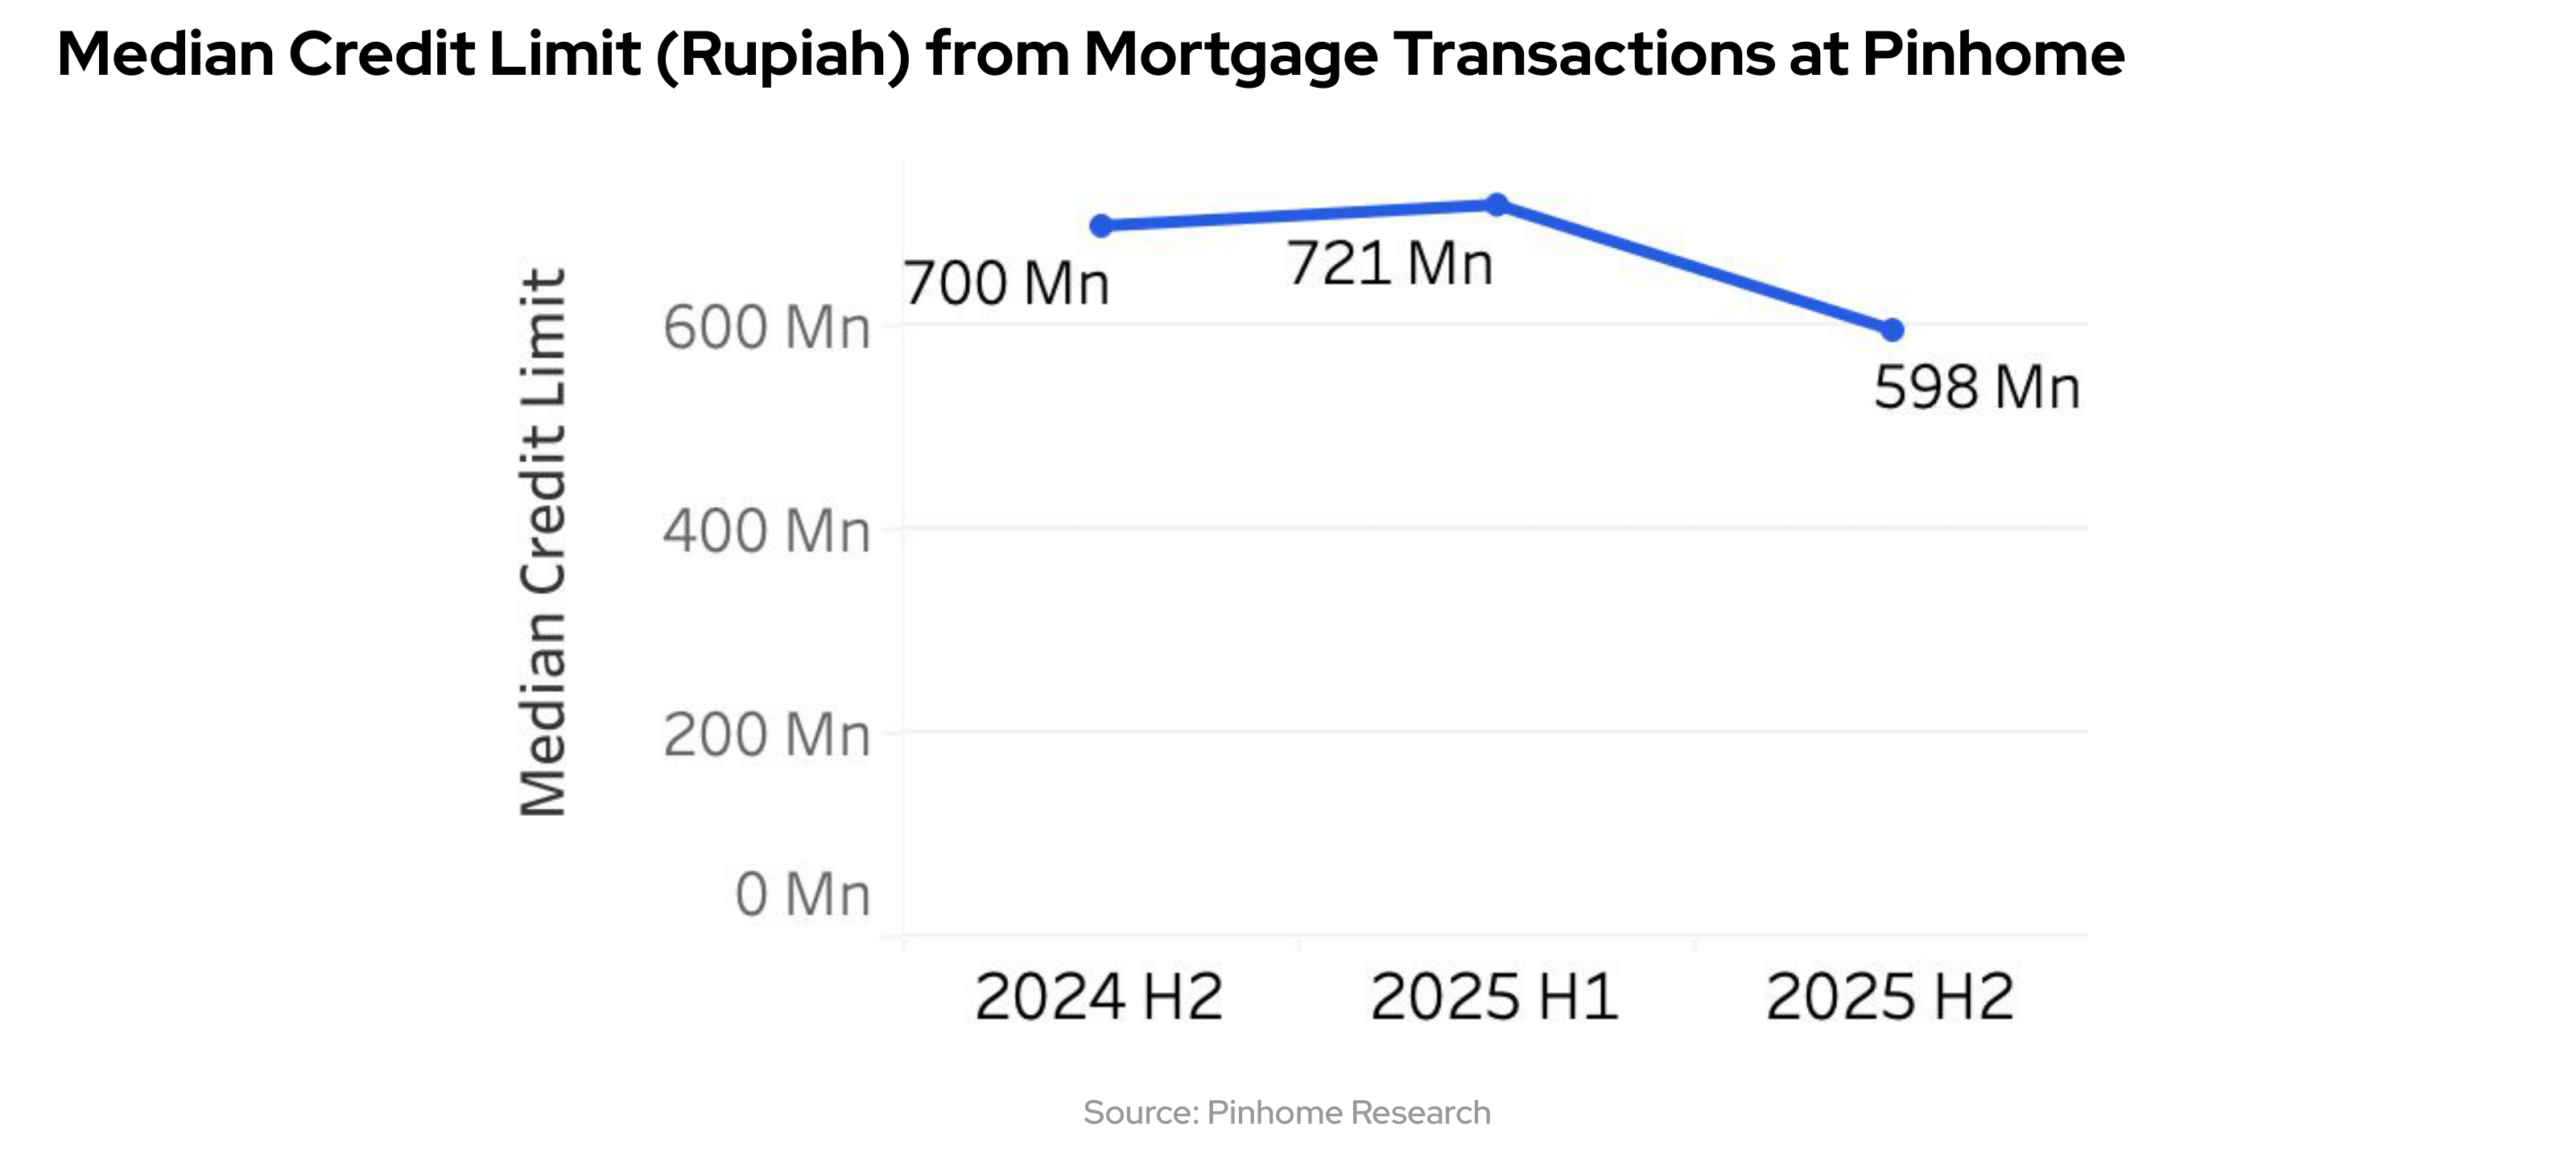
This decrease in mortgage application values should not be viewed as market weakening, but rather as a form of consumer maturity in investing. This cautious attitude of customers in aligning credit limits with real income actually creates a healthier financing ecosystem that is more resilient to the risk of non-performing loans. The market focus, which has now shifted toward more affordably priced housing, ensures that the property industry remains productive while providing a greater opportunity for people to achieve their first house without sacrificing long-term financial stability.
Reversal Trend in the Interest Index for Secondary House Mortgages
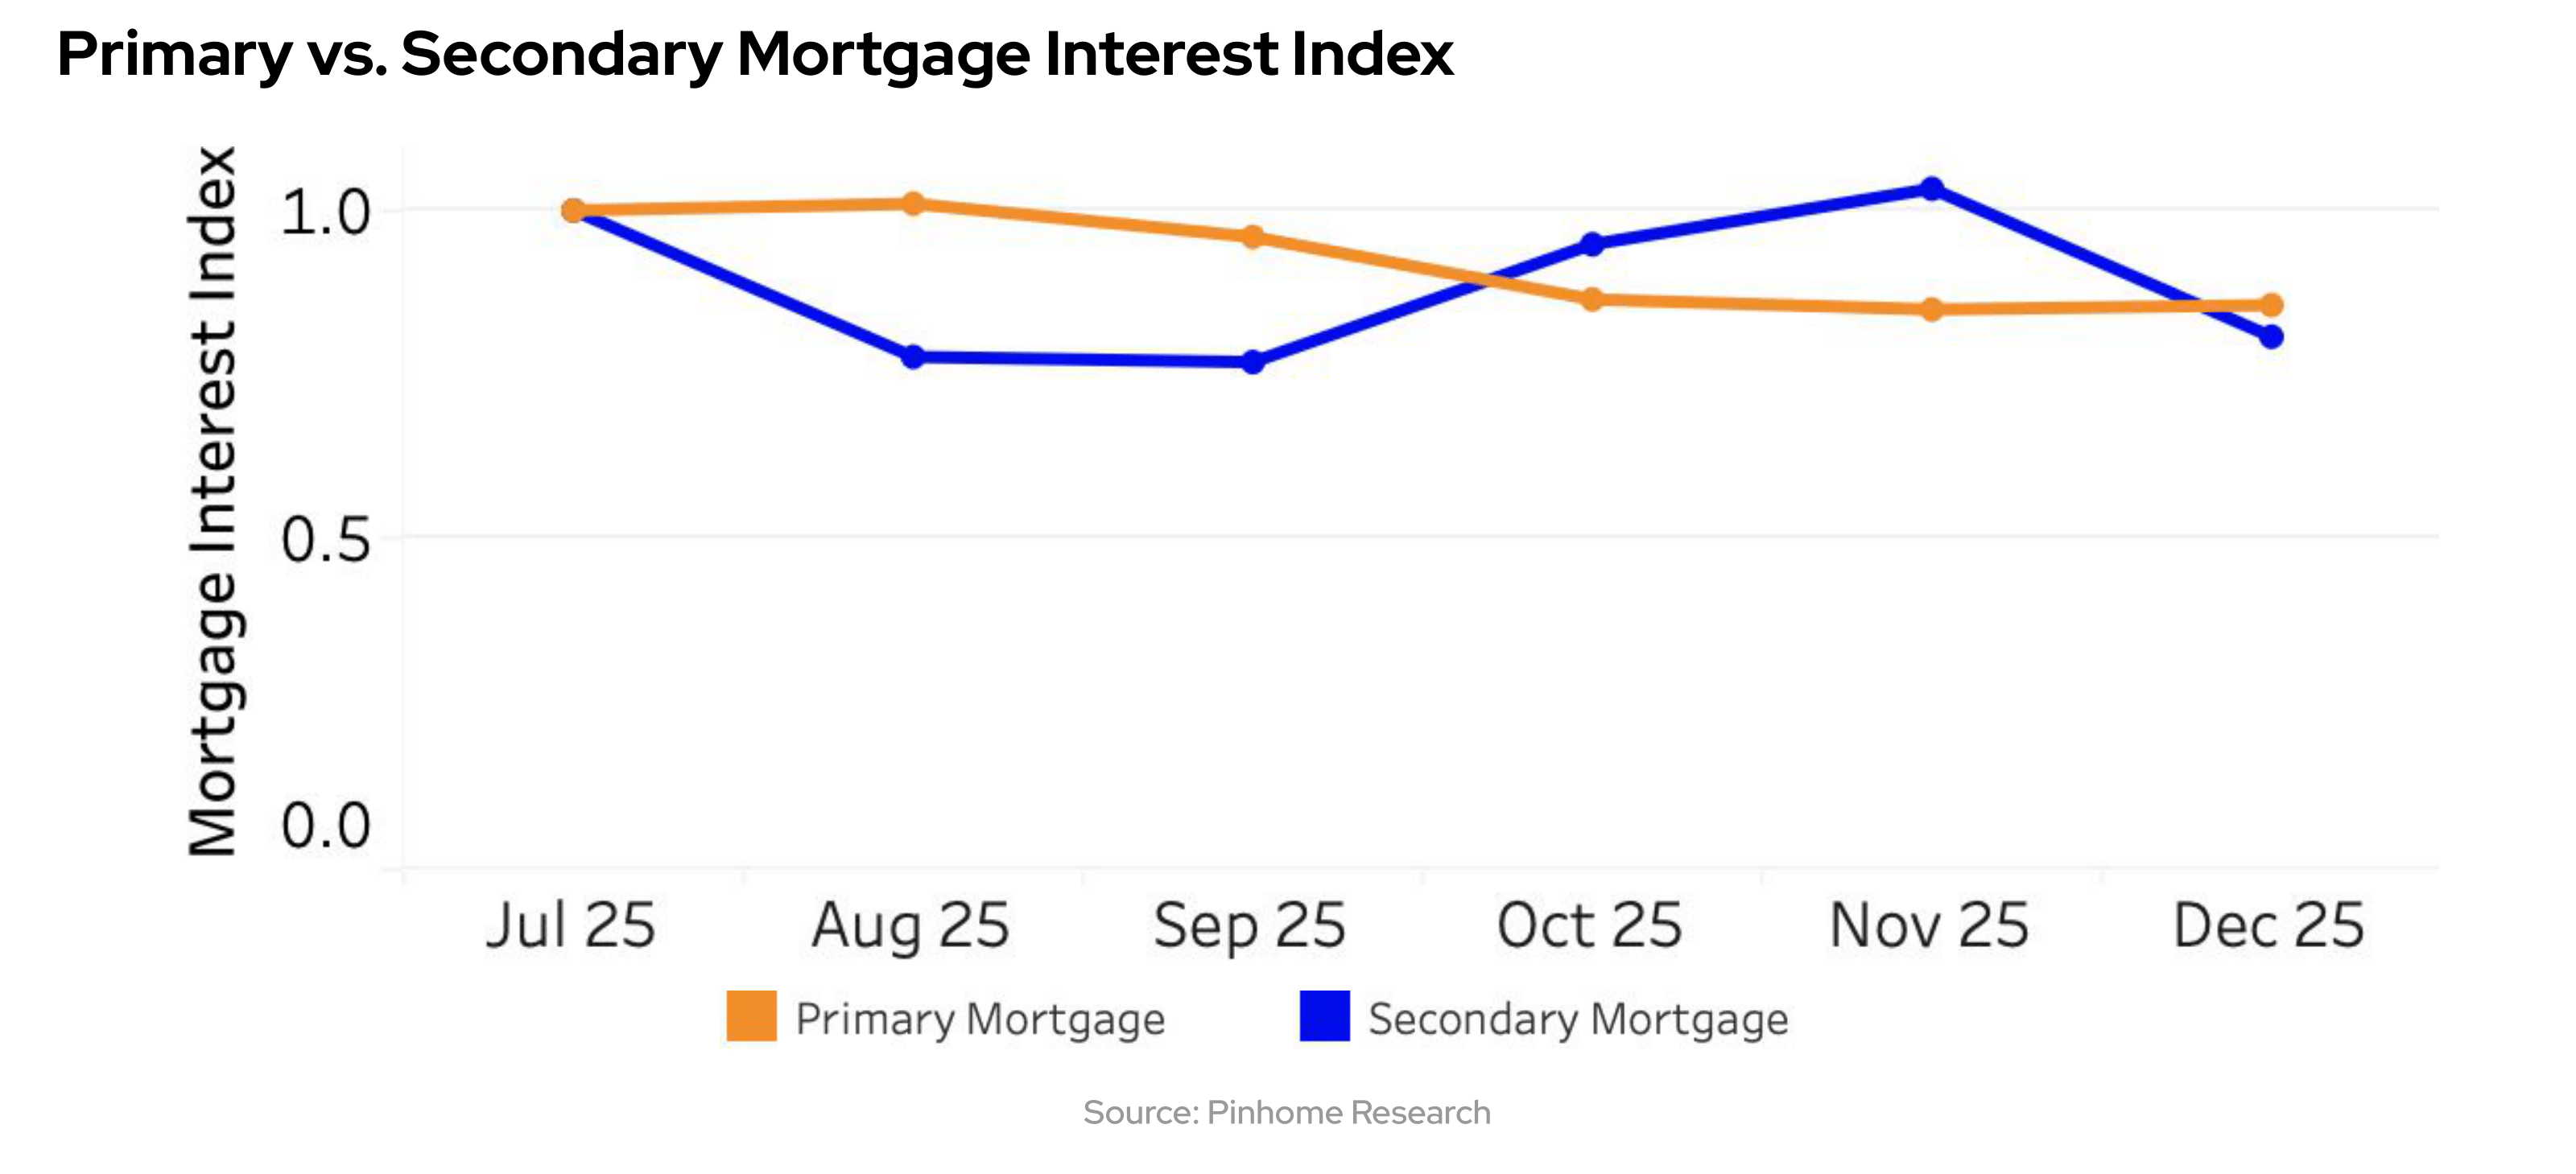
The financing dynamics in the 2nd semester of 2025 show a significant shift in the patterns of the mortgage interest index between the new house and secondary house segments. Based on internal data, there is a reversal trend following a period of social turbulence in August to September 2025.
While the interest index for primary mortgages previously tended to be stable at a high level, entering the fourth quarter of 2025, the secondary mortgage interest index instead showed a consistent growth trend until it surpassed the primary mortgage interest index. This shift indicates that the secondary market has now become the primary choice for consumers in the national property financing credit absorption.
Growth in the secondary mortgage market reflects a more pragmatic consumer stance in managing household liquidity. A primary driver of this shift is the consumer's effort to avoid the double expenditure burden that often occurs when purchasing a new house under an "indent" (pre-construction) system.
In new house projects still under construction, buyers are often faced with the difficult situation of having to start paying mortgage installments while simultaneously bearing the cost of temporary rental housing because the house is not yet ready for occupancy. By choosing a secondary house, consumers gain physical certainty that allows them to move in immediately, enabling the budget previously allocated for rent to be fully redirected toward paying the property installments.
Mortgage Take Over and Top Up Trends: Customer Efficiency and Liquidity Strategies
The increase in interest toward the secondary market discussed previously goes hand in hand with changes in customer strategies for managing their financial obligations. Based on internal data, there has been a major shift in the financing composition, where the proportion of Mortgage Take Over and Top Up has increased significantly. While the proportion stood at 57% in the 1st semester of 2025, that figure surged sharply to 74% in the 2nd semester of 2025. This indicates proactive steps by customers to seek interest expense efficiency as well as access to liquidity.
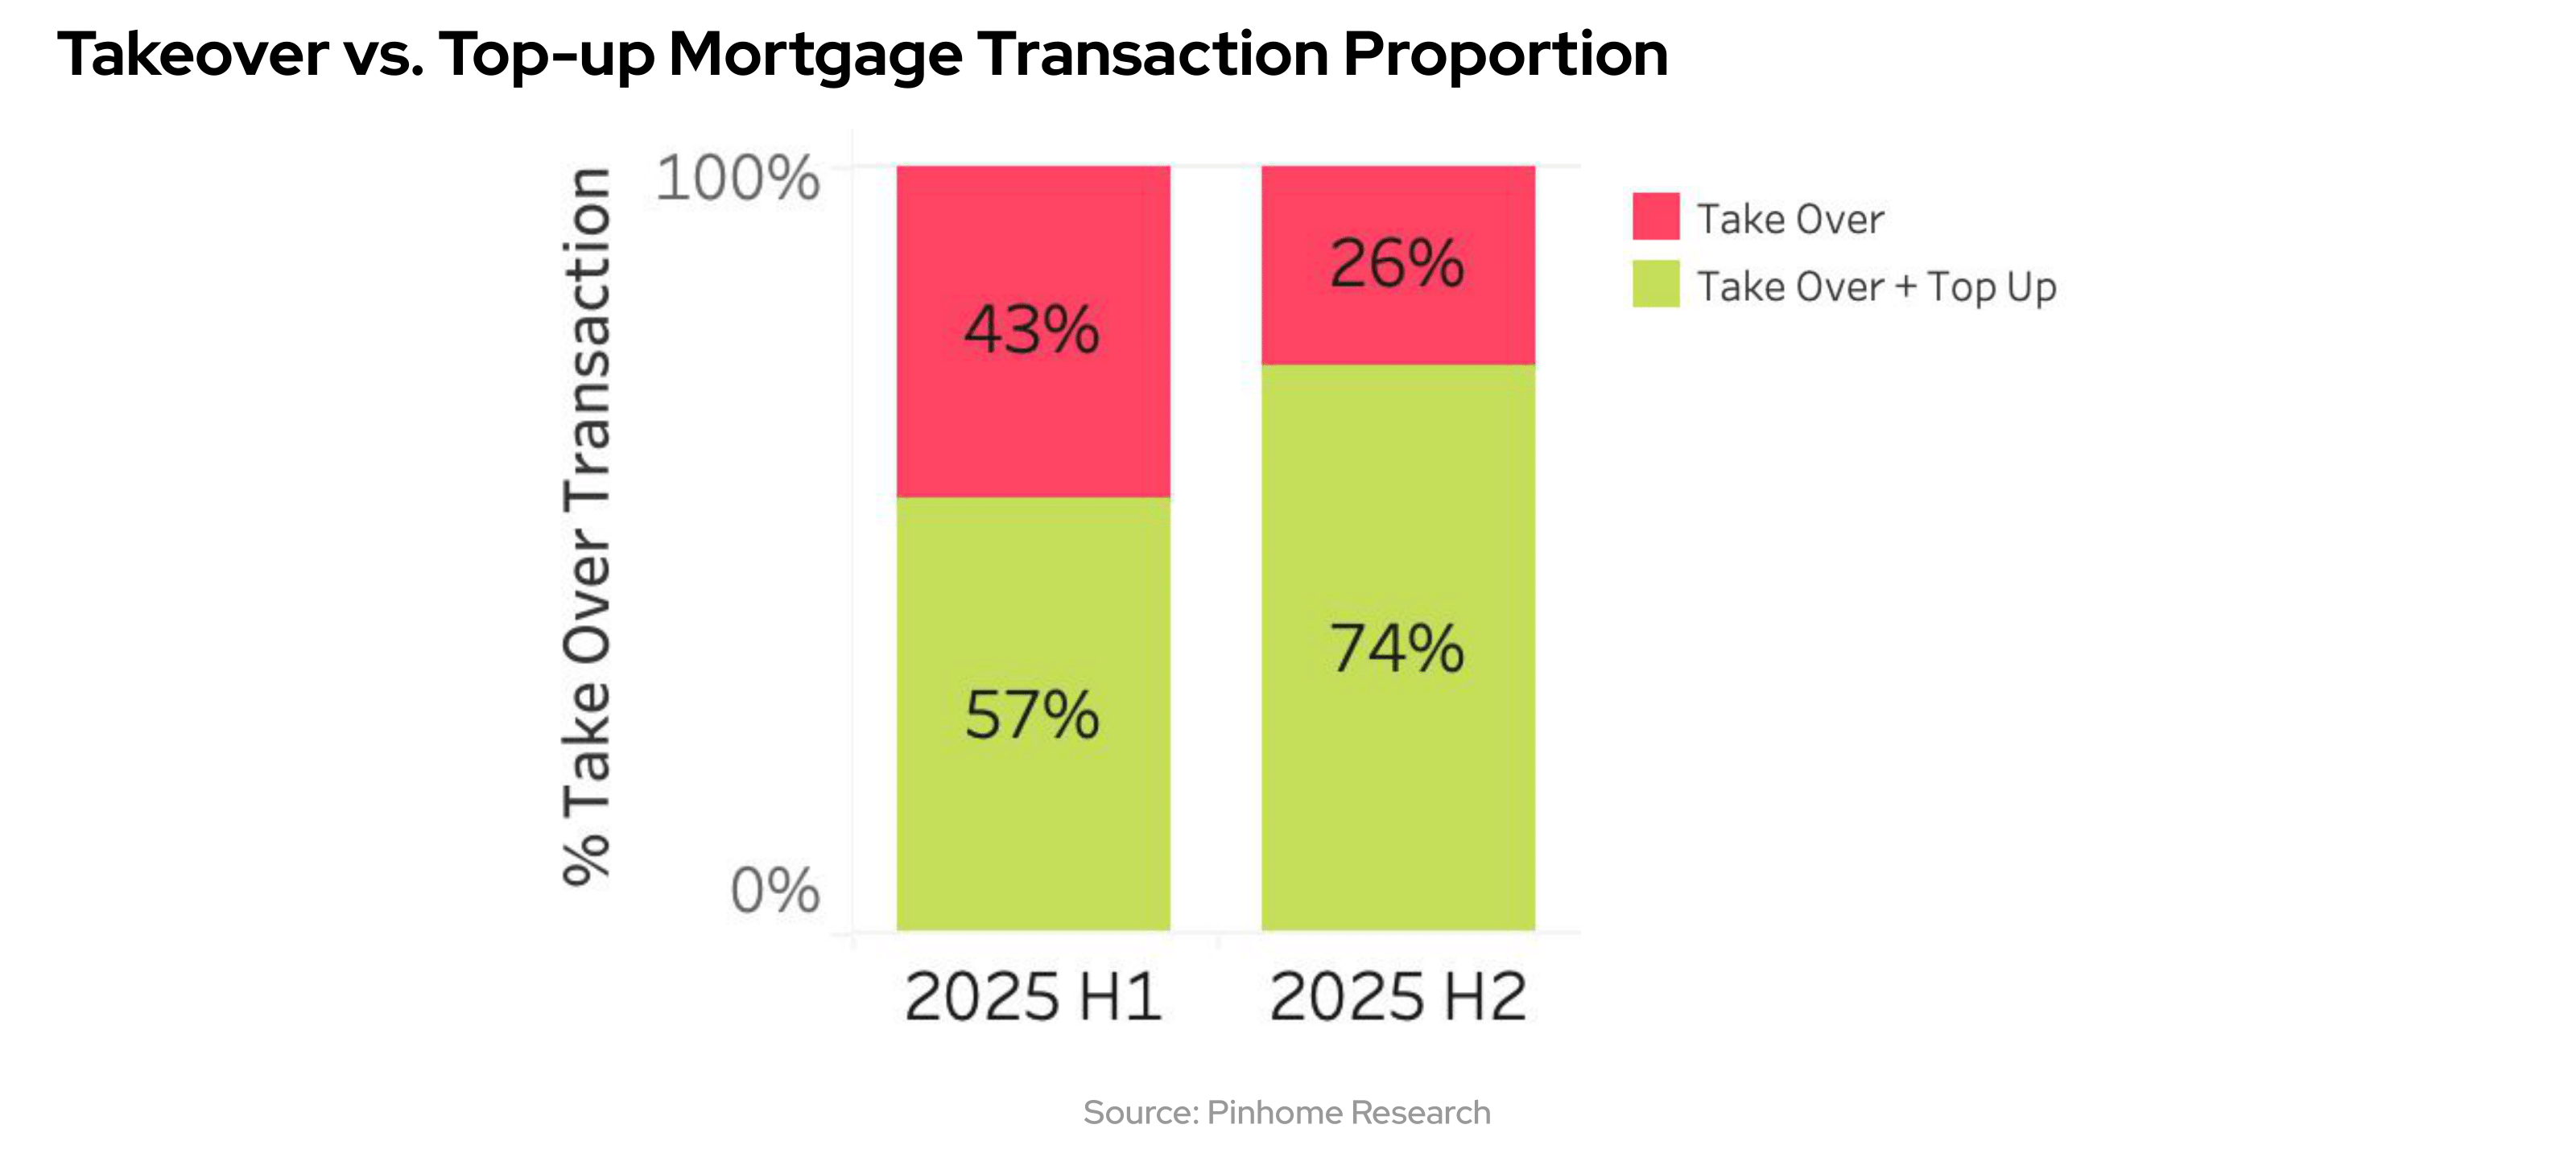
This increase in proportion indicates that debtors are becoming smarter and more sensitive to banking interest rate dynamics. Customers are actively utilizing top-up features that allow property owners to obtain additional funds, which are typically allocated for productive needs or renovations to increase the property's value.
Overall, this 74% dominance serves as an important signal for the banking industry that customer loyalty is now at a highly competitive point. Banks are now required to not only focus on acquiring new customers but also to strengthen retention programs by offering more flexible financing schemes to avoid losing their existing customer base, which is increasingly active in conducting market comparisons.
Mortgage Program Innovation in Liquidity and Loyalty Management
The rising and highly competitive trend of take over + top up, as discussed previously, has forced the banking industry to respond by launching more innovative programs to maintain its customer base. Entering the 2025 to 2026 period, banks are no longer competing solely through the size of initial promotional interest rates; instead, they have begun offering financing schemes that are more flexible and integrated with other financial products. This innovation emerges as a dual strategy for banks to maintain internal liquidity levels while simultaneously locking in long-term customer loyalty amidst a market that is increasingly active in comparing benefits between banks.
One of the most prominent innovations is the mortgage program linked directly to the customer's savings balance, often referred to as a balance-linked mortgage. In this scheme, the bank offers a reduction in mortgage interest expenses calculated based on the total balance maintained in the customer's savings account. In some more progressive products, if the customer's total savings equal the remaining principal debt (mortgage outstanding), the customer can even enjoy interest rates as low as zero percent. This approach is highly effective for banks to maintain the availability of third-party fund liquidity, while customers benefit from significant interest efficiency without losing access to their deposited funds.
In addition to savings integration, banks have also begun introducing features that pay closer attention to the overall customer financial experience, such as options to temporarily suspend principal installments for specific periods. These innovations signify a shift in banking focus, which now prioritizes customer retention through the ease of managing family cash flows. By offering solutions that combine housing finance and deposit optimization, banks hope to create a mutually beneficial ecosystem where customers feel more empowered in managing their debt and banks maintain a stable funding structure to face future market dynamics.


The year 2026 is projected to be a period of acceleration for the property sector, supported by the government's optimistic economic growth target of 6.0% and a 5.0% projection from Bank Indonesia. The national fiscal foundation is also becoming firmer, with state expenditure allocated at 3,842 trillion rupiah, an increase of 8.9% compared to the previous year. This more expansive budget, coupled with deficit management strictly maintained at 2.68%, provides the market with certainty regarding the sustainability of economic stability in the second year of the administration. On the financing side, the banking sector continues to show solid fundamentals, with credit growth reaching 7.74% (YoY) as of November 2025. This achievement serves as a strong basis for strengthening banking intermediation functions in 2026, especially as room for domestic interest rate cuts becomes available.

Beyond being driven by positive macro sentiment, regional growth will be heavily influenced by dynamics in two strategic areas. The recovery of the Sumatra region post-disaster and the increasingly massive development of downstreaming (hilirisasi) will be local growth engines, supported by the ongoing synergy of national infrastructure policies. The integration of fiscal stimulus, stable banking conditions, and the adoption of AI technology is expected to drive transaction volumes back to healthier and more sustainable levels. With these solid fundamentals, the property sector in 2026 is not merely recovering but transforming to follow a new, more distributed, and efficient direction of economic growth.
Demand & Inventory Stimulus Aspects: PPN DTP & Housing KUR
The government is striving to drive the property market in 2026 by simultaneously strengthening the demand and inventory sides. From the demand side, the extension of the 100% VAT Exemption incentive until December 2027 provides long-term certainty for potential first-time house buyers and investors alike. The certainty of this incentive duration is crucial as it removes the pressure to buy in a rush, giving consumers more time to plan their finances. From a price competition perspective, this policy makes new units from developers competitive again when compared to a secondary house in the secondary market.
On the inventory side, working capital constraints experienced by small and medium-sized developers in 2025 are being addressed through the Housing KUR (People’s Business Credit) scheme. Access to this subsidized working capital provides a solution for developers who previously struggled to continue projects due to cash flow limitations. With the recovery of developer activity in the lower-middle segment, the inventory deadlock for affordably priced houses is expected to resolve throughout 2026. This is crucial to ensure that unit availability is maintained in line with increasing public buying interest.
Although there is generally a seasonal pattern where search interest tends to weaken at the end of the year due to shifts in consumer spending priorities, the housing segment below 1 billion rupiah shows unique resilience. In December 2025, searches in this house segment actually recorded a growth of +5% on a monthly basis. This trend contrasts with the category of houses above 1 billion rupiah, which experienced a -3% decline during the same period.
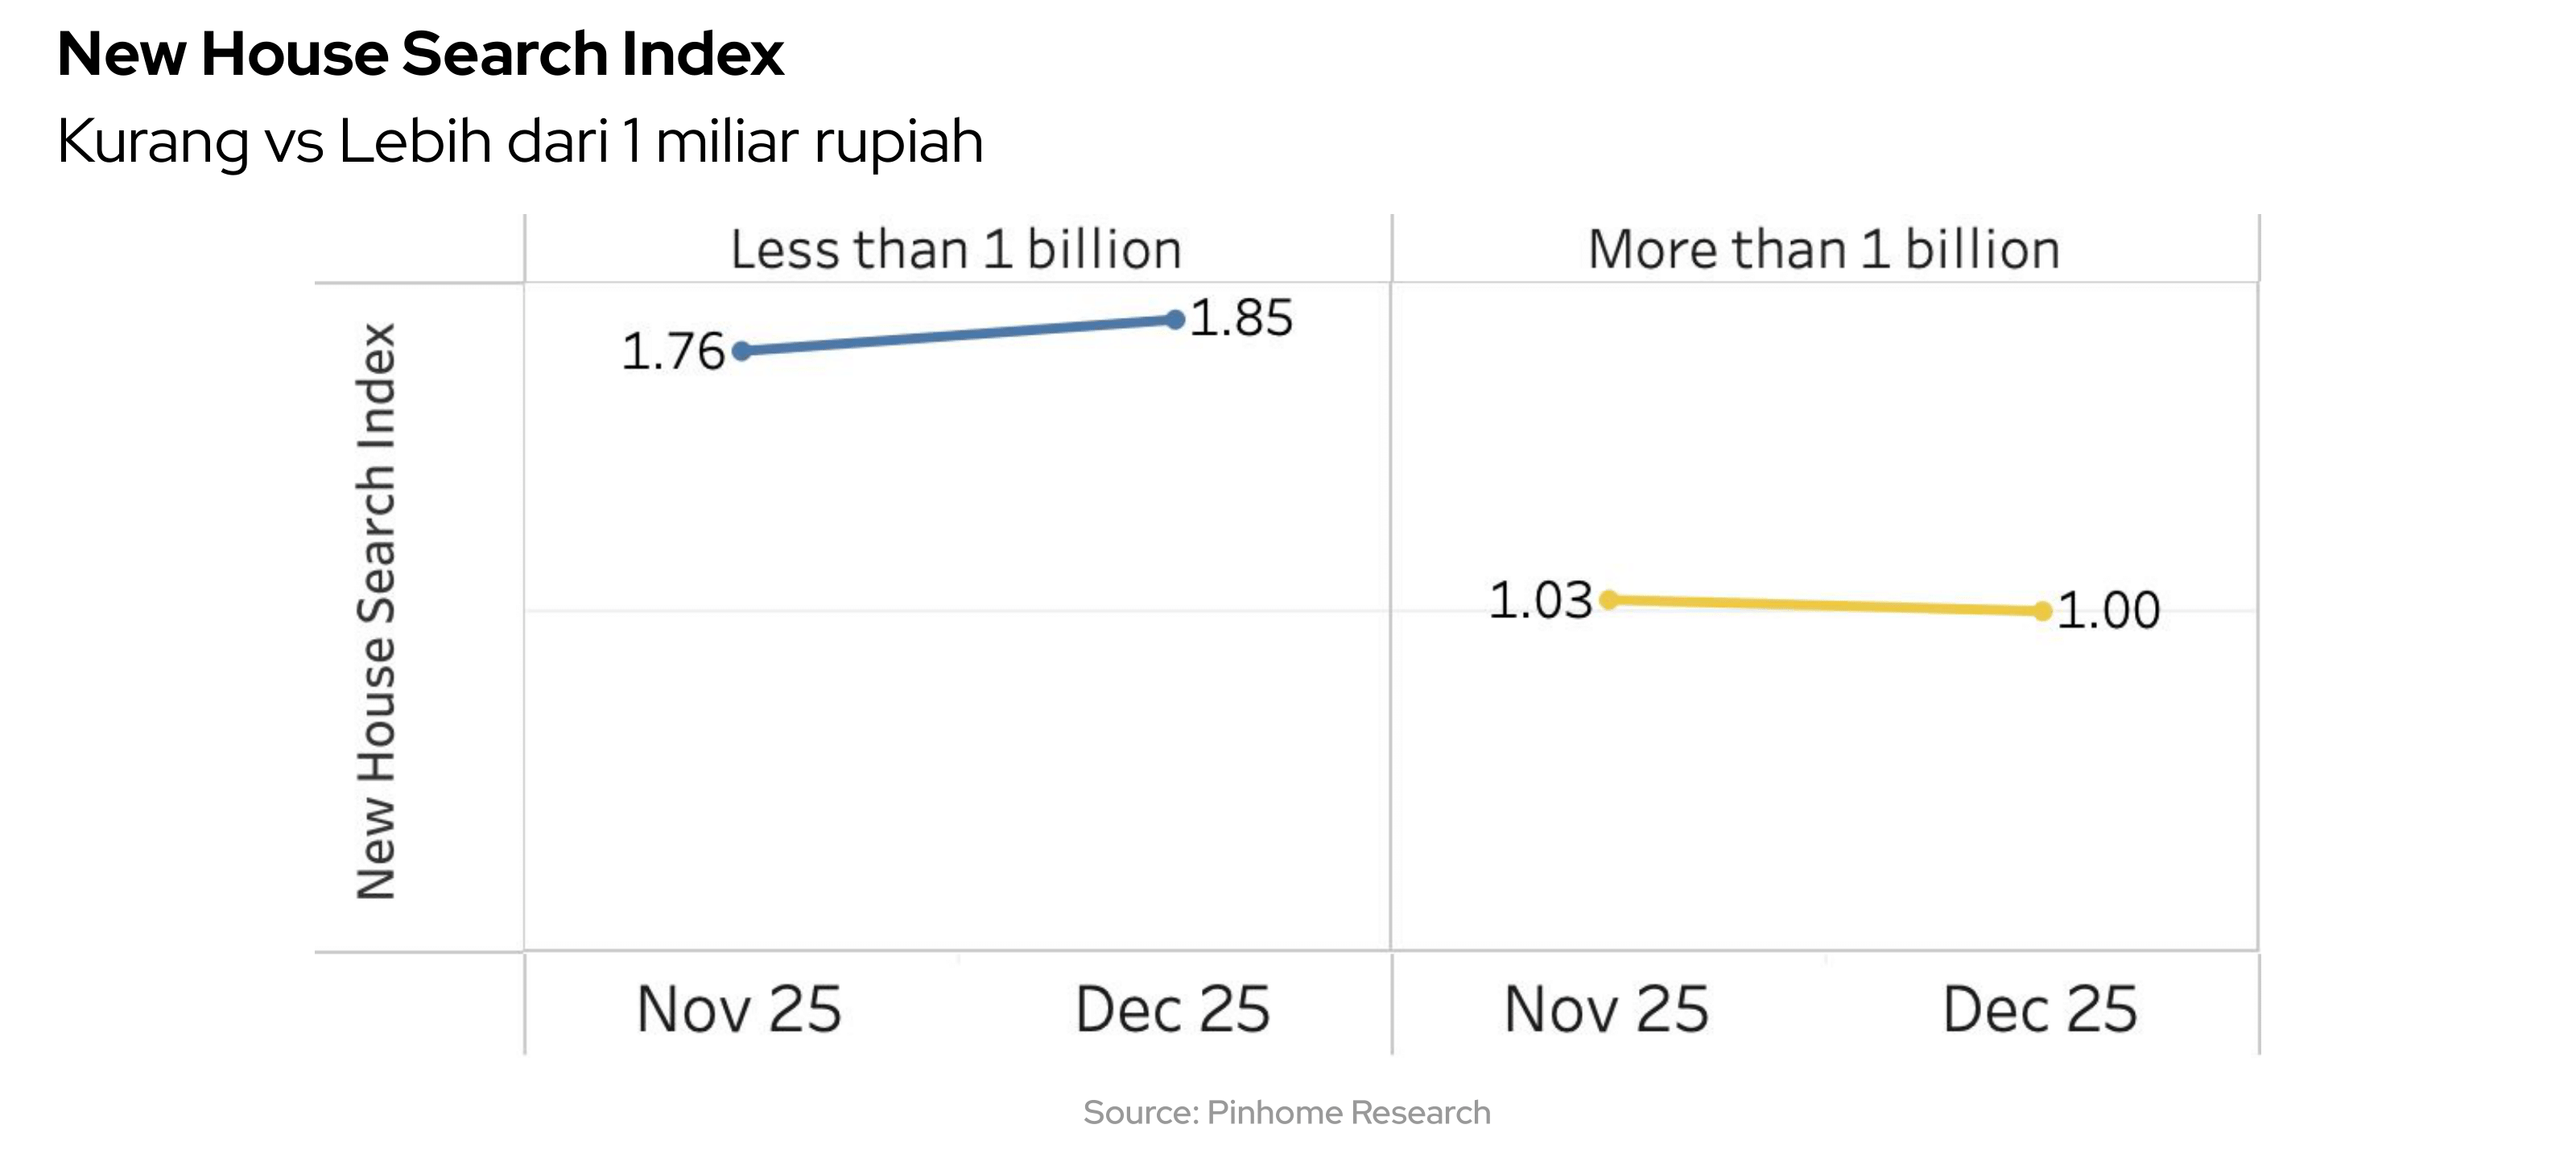
This growth in searches confirms that the VAT Exemption price limits remain the primary benchmark for consumers seeking primary housing. The recovery of interest in the primary market is a positive signal that the fiscal stimulus provided by the government is effective in maintaining the property industry's momentum in the coming year.
Political Stability in the Second Year of Administration
Historically, the second year of a presidential term in Indonesia is often a more stable period as the process of power consolidation and cabinet formation has been finalized. This calmer political climate provides certainty for market players to begin moving their capital again. Entering 2026, this stability is expected to be a primary driver for the resurgence of pent-up demand that was delayed throughout 2025. The market is currently awaiting the technical realization of various housing incentives promised by the cabinet, which has now been in office for a full year.
Certainty regarding the extension of the 100% VAT Exemption for the 2026-2027 period serves as a highly anticipated positive signal for the industry. Furthermore, the government's commitment to increasing the Housing Financing Liquidity Facility (FLPP) quota to pursue public housing targets provides an additional boost for the lower-middle market. The existence of this regulatory certainty helps consumers move out of a "wait and see" position and begin executing transactions that were previously delayed due to concerns over policy direction changes during the transition period.
Our internal data records the initial response to this stability through a rising search trend in the luxury house segment toward the end of 2025. The luxury house segment (houses priced above 3 billion rupiah) showed significant search growth; after growing by +20% quarter-on-quarter in the 3rd quarter of 2025, searches grew again by +36% in the 4th quarter of 2025
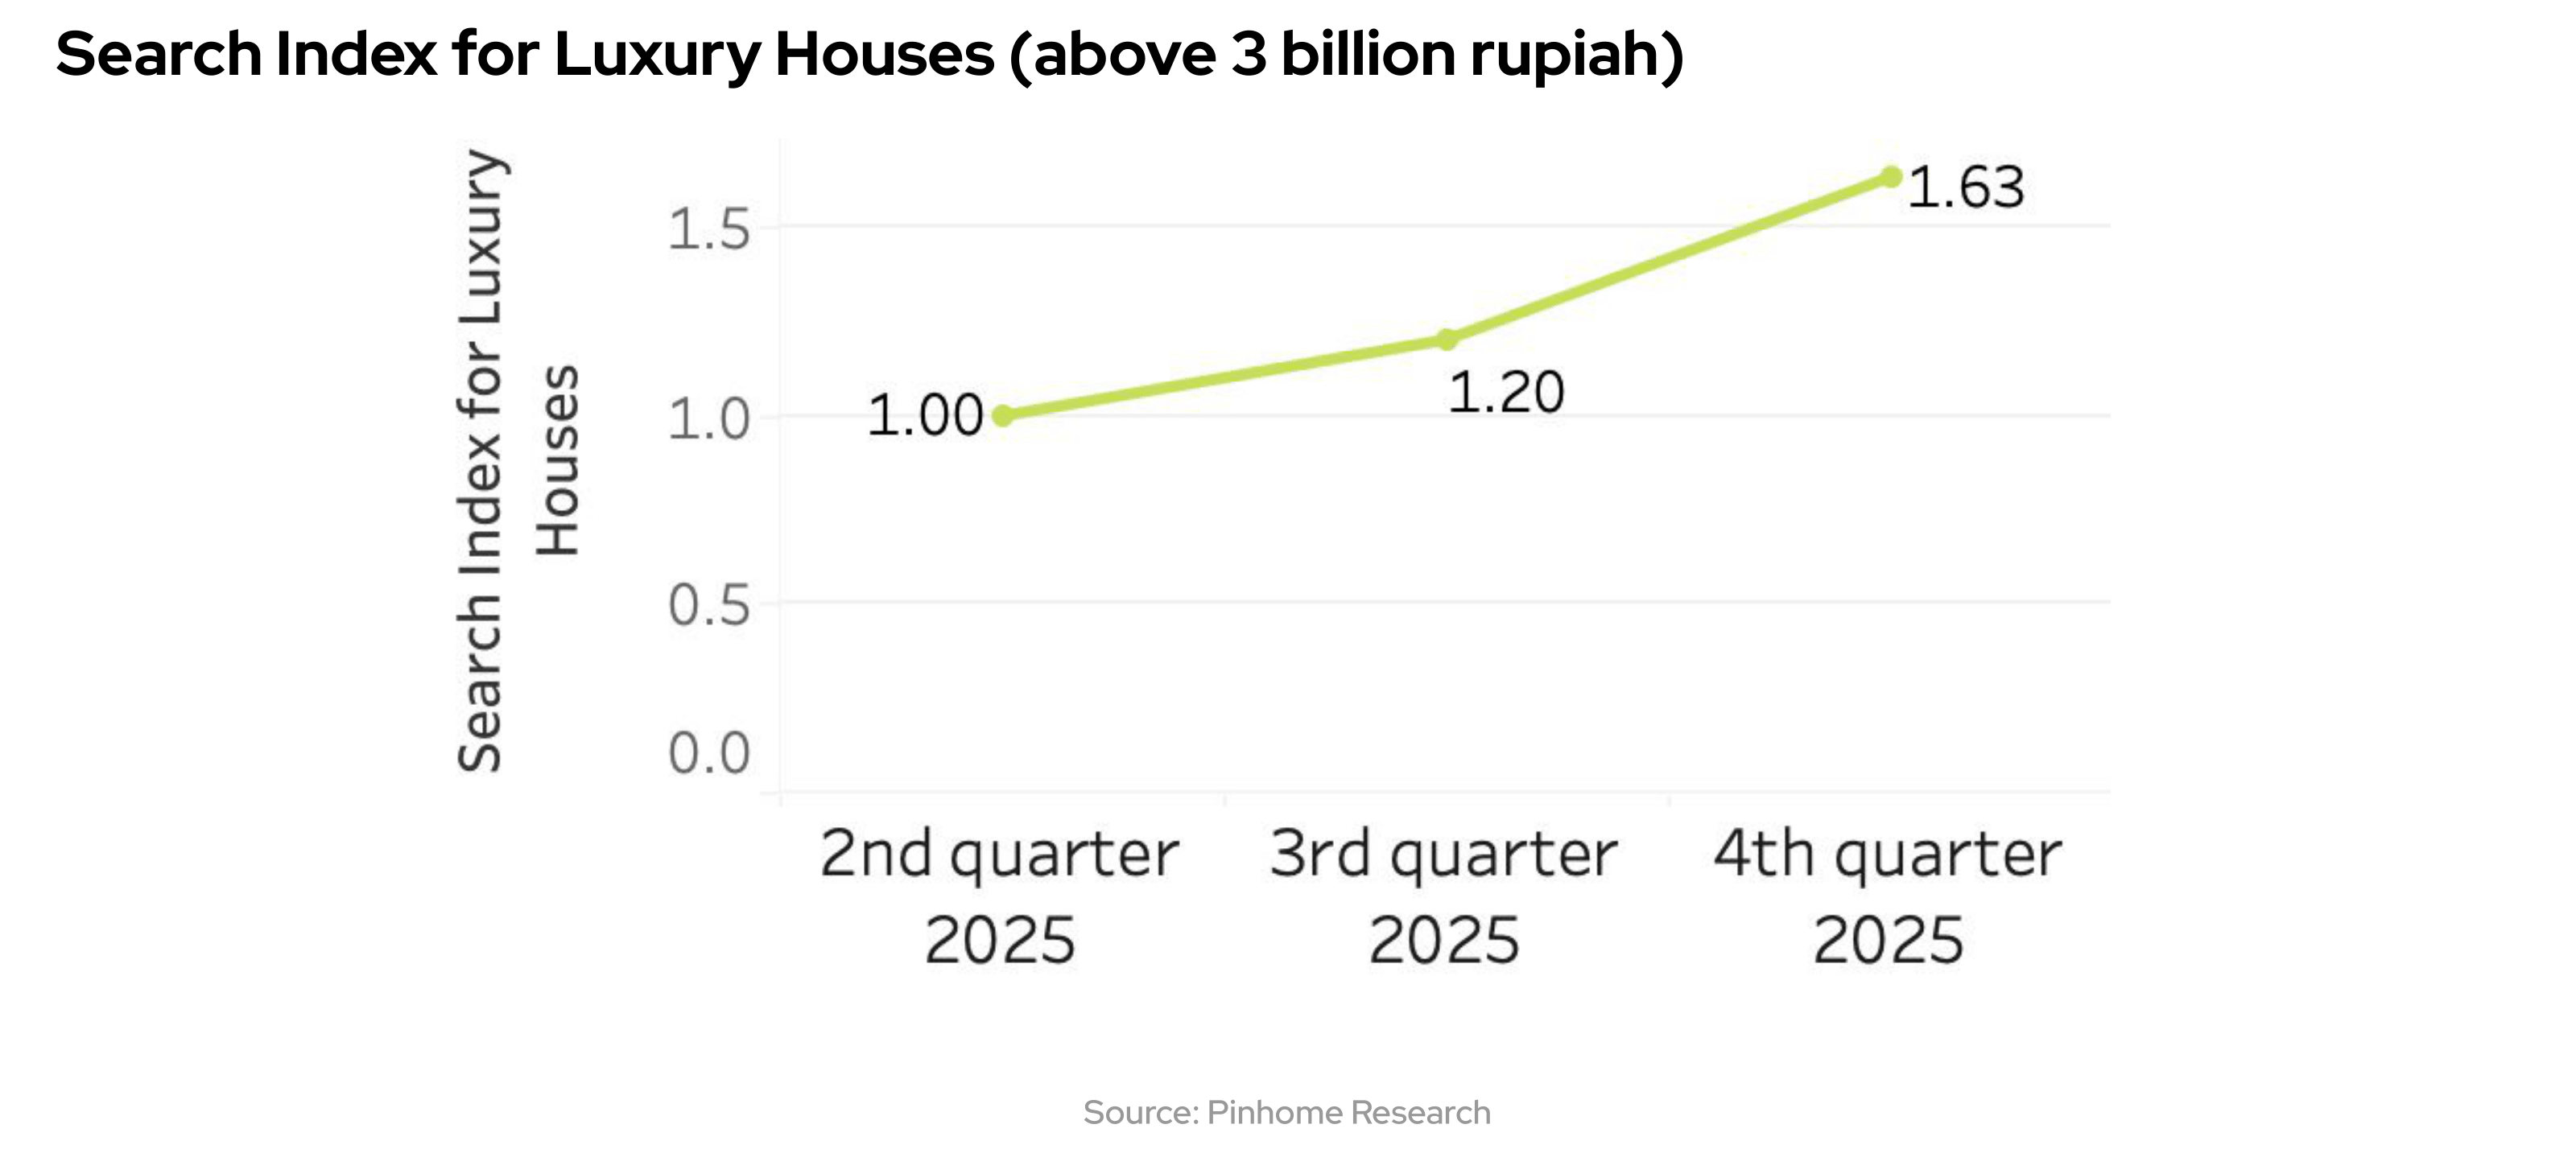
This significant surge indicates that major investors tend to take earlier action once political uncertainty risks are deemed to have subsided. This group has a high sensitivity toward investment security and typically executes transactions before the mass market (the middle segment) begins to move, in order to avoid potential future price adjustments when general market demand fully recovers.
Furthermore, increased activity in the luxury house segment will improve the liquidity of large-scale developers. The cash flow generated from luxury unit sales will provide developers with the capacity to accelerate construction and the provision of house stock in the middle and lower segments. Thus, recovery in the high-price segment serves as a leading indicator for increased productivity across all layers of the property market in the subsequent period.

Whoosh Operational Maturity: Tol Getaci Sentiment and Demand Shifts in East Bandung
Entering 2026, the operational impact of the Whoosh High-Speed Railway has entered a maturity phase, where this infrastructure is no longer viewed as speculative sentiment but rather as a fundamental factor maintaining housing demand stability. The community's commuting patterns, which have stabilized over the past year, have created a permanent demand base in areas surrounding the main stations, particularly for consumers seeking travel time efficiency to Jakarta while still wishing to reside in the Bandung region.
Property search growth in East Bandung is currently concentrated in the Cileunyi and Rancaekek districts, Bandung Regency. Based on our internal data, throughout the 2nd semester of 2025, Cileunyi recorded a search growth of +12% compared to the 1st semester of 2025 and grew +18% compared to the 2nd semester of 2024.
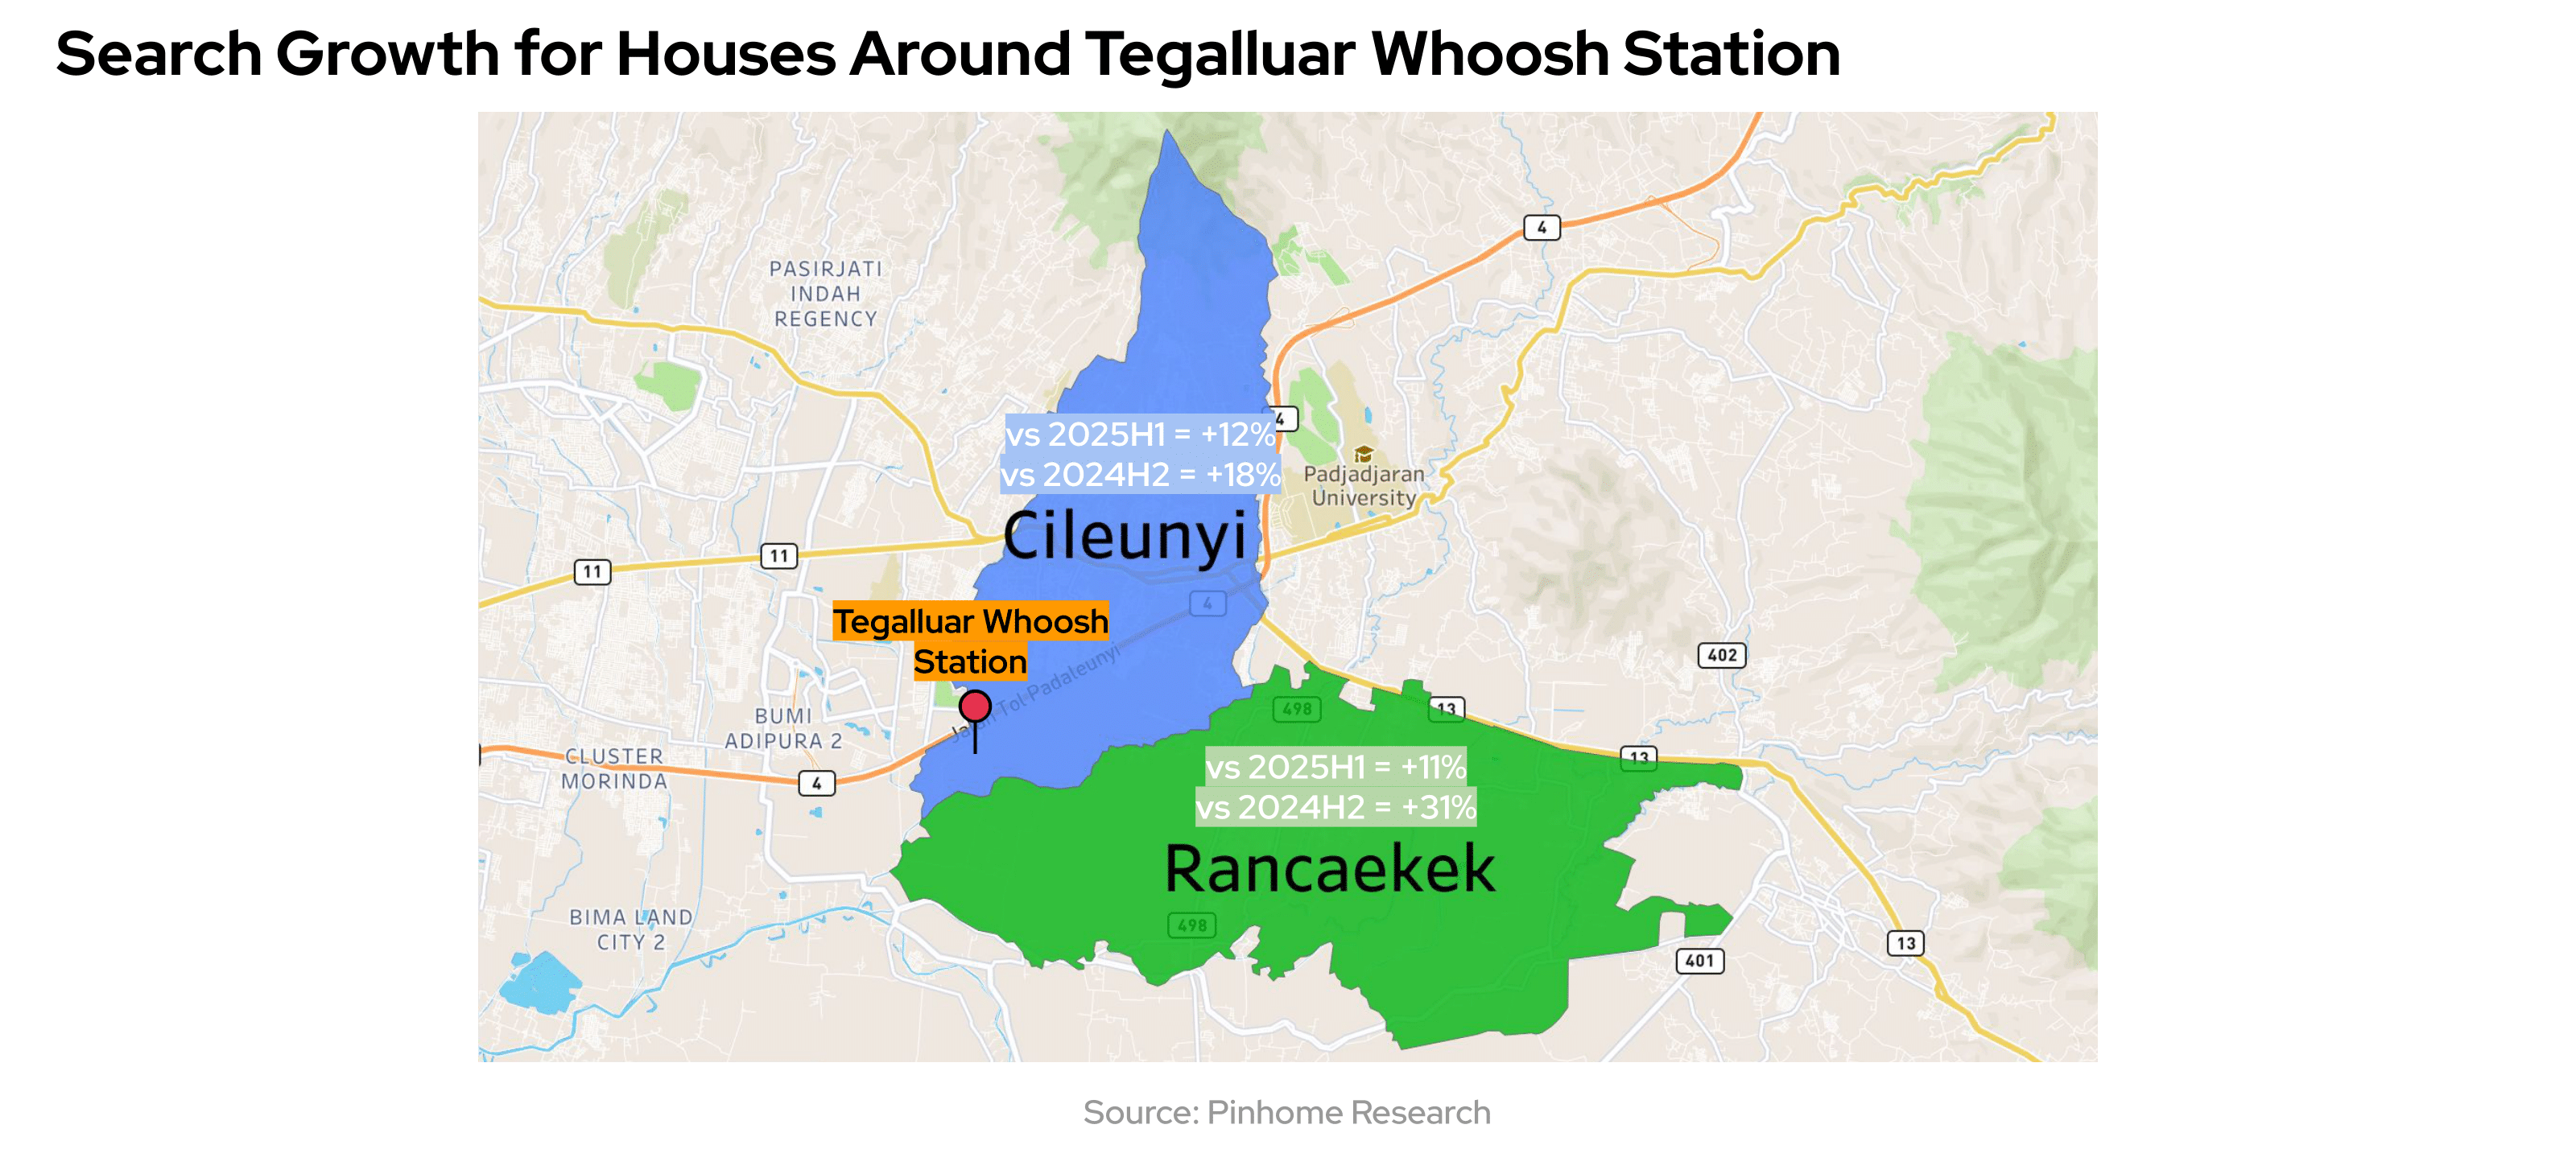
This surge in interest is significantly driven by the clear construction progress of the Getaci Toll Road (Gedebage–Tasikmalaya–Cilacap) in its initial sections. The presence of this toll road plan provides strategic added value for Cileunyi, which is now positioned as a transportation gateway connecting Bandung with the southern route of Java, as well as providing quick access to the Tegalluar Whoosh Station.
A more progressive growth trend is visible in the Rancaekek District, where searches throughout the 2nd semester of 2025 increased by +11% on a semi-annual basis and surged by 31% compared to the 2nd semester of 2024. The high annual growth rate in Rancaekek confirms a phenomenon of demand shifting from the Gedebage area. With property prices in premium points like Gedebage (Summarecon housing) reaching a saturation point for the middle segment, consumers are logically eyeing Rancaekek as a more affordable alternative.
Throughout 2026, Cileunyi and Rancaekek are projected to be the driving forces of the East Bandung property market. The annual growth reaching 31% in Rancaekek signifies the vast potential for asset value appreciation as the physical progress of the Getaci Toll Road continues. With land prices that remain competitive, both areas will become the primary focus for middle-class residential development and a rational long-term investment target for market players.
Resilience of the Property Market in Sumatra Post-Flood Disaster
The property market in the main cities of Sumatra showed strong dynamics throughout the 2nd semester of 2025. Based on internal data, the period from July to October 2025 was a solid growth phase. Cities such as Medan, Palembang, and Pekanbaru recorded average monthly growth of 13%, 8%, and 5%, respectively. This positive trend confirms that market interest in the region was actually on a positive trajectory.
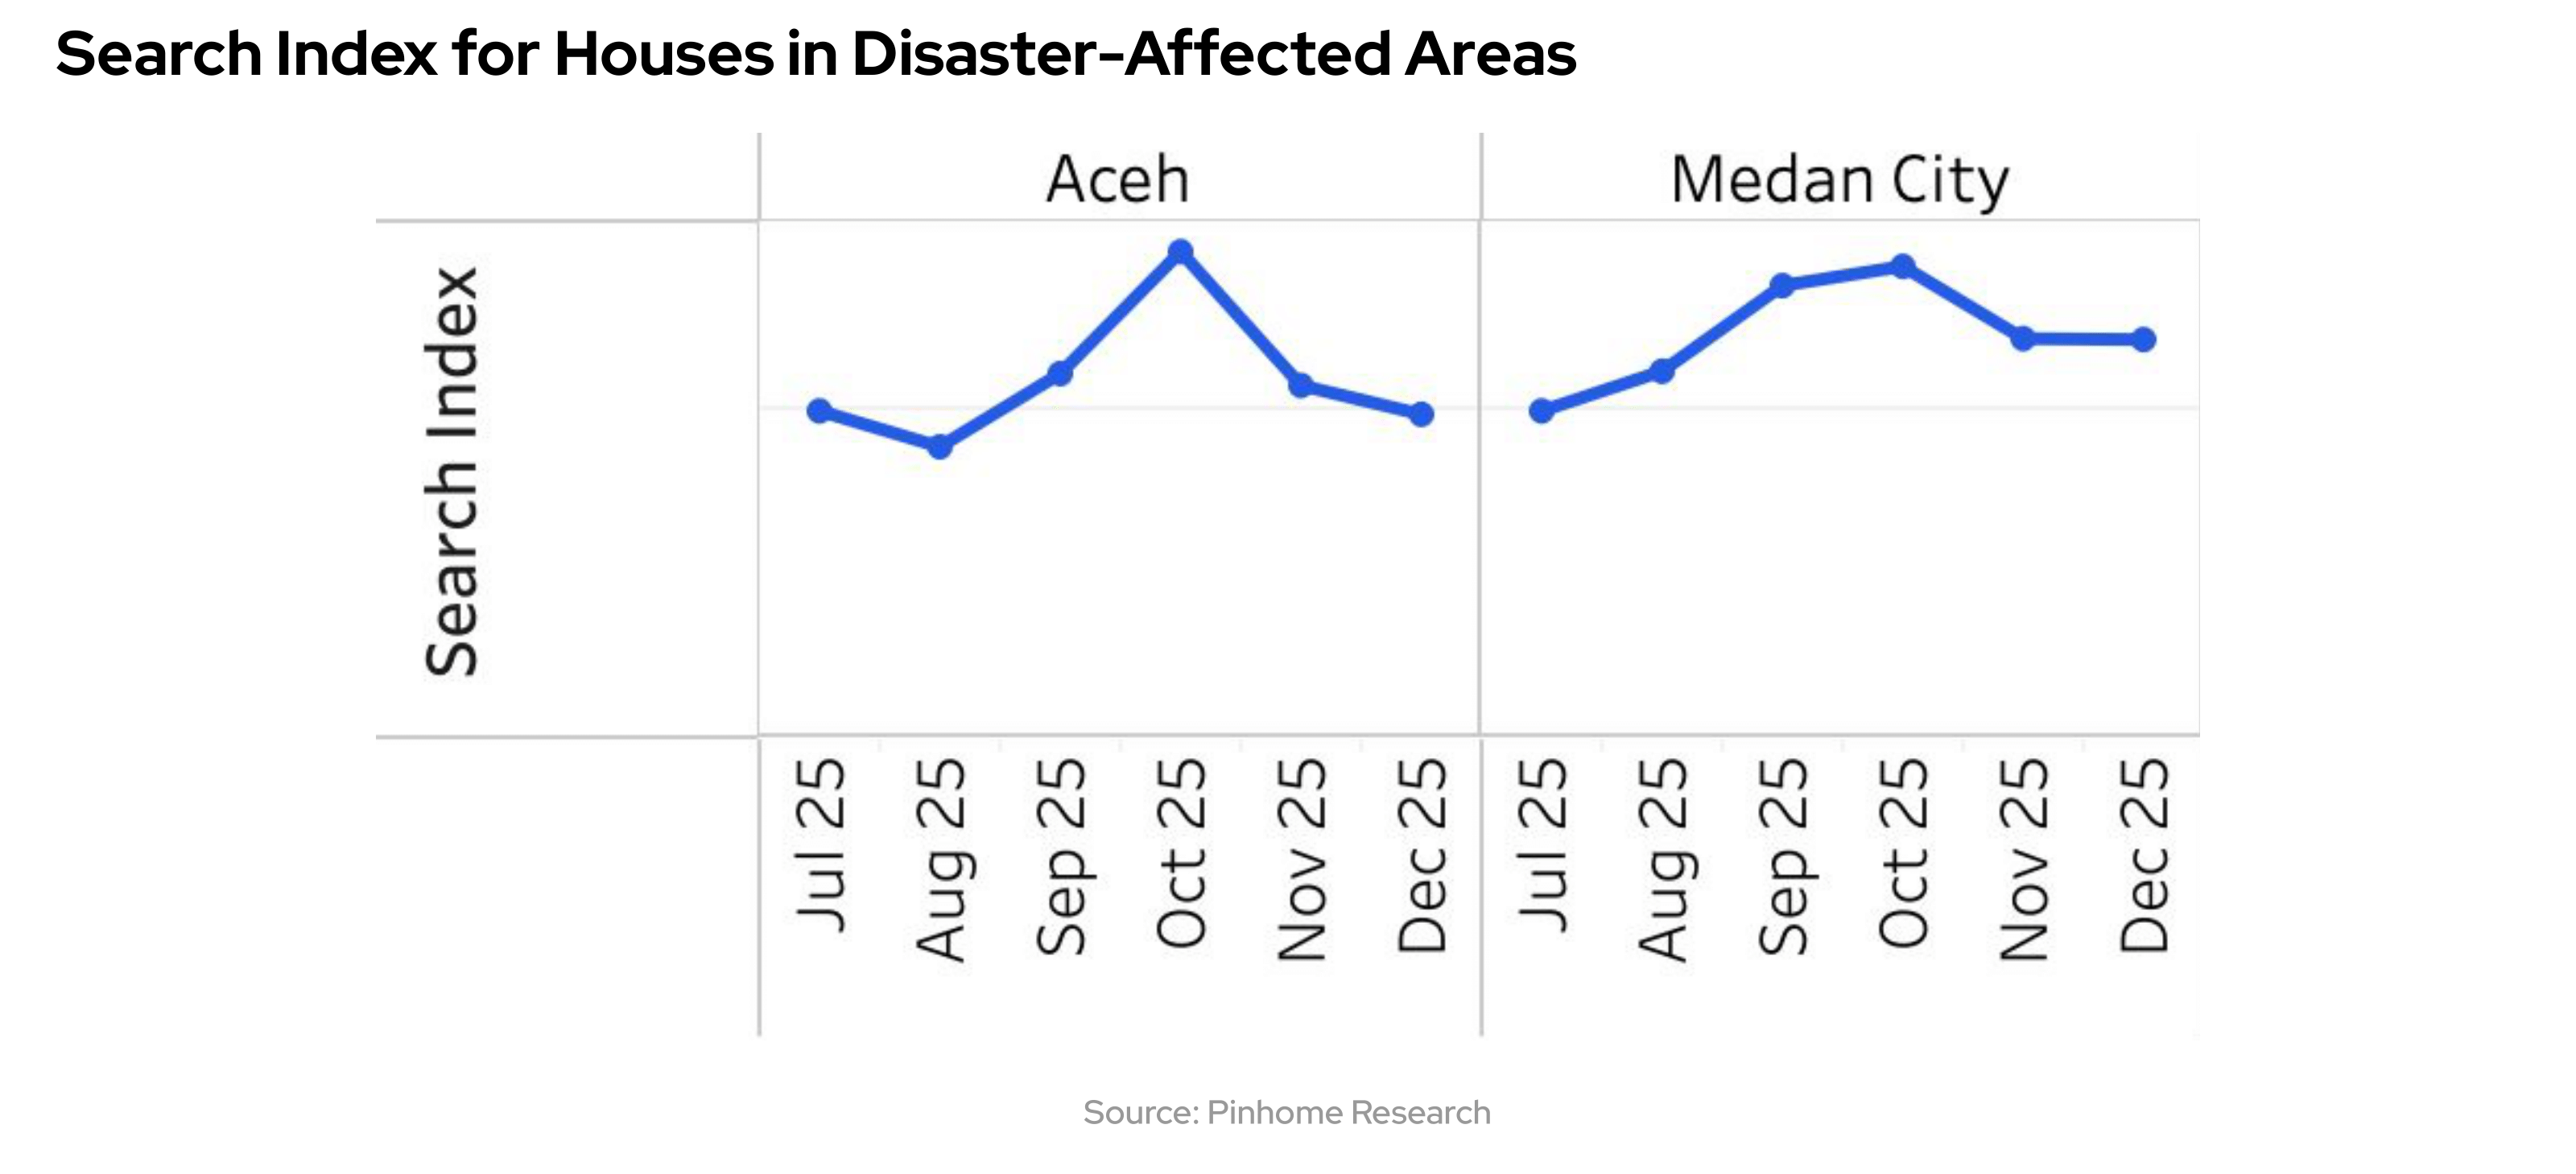
Entering November 2025, Sumatra faced significant external challenges due to extreme weather that triggered flash floods and landslides in several strategic areas. According to internal data, the heaviest impact was felt in the northern region of Sumatra, particularly in Aceh Province and the city of Medan, which recorded the highest fatality rates and infrastructure damage. This was directly reflected in property search volumes in Aceh Province, which saw a sharp correction of -28% in November 2025. Medan experienced similar pressure with a -15% decrease in search interest. This drastic decline indicates that the focus of the community in the severely affected areas shifted entirely toward emergency response and post-disaster recovery efforts.
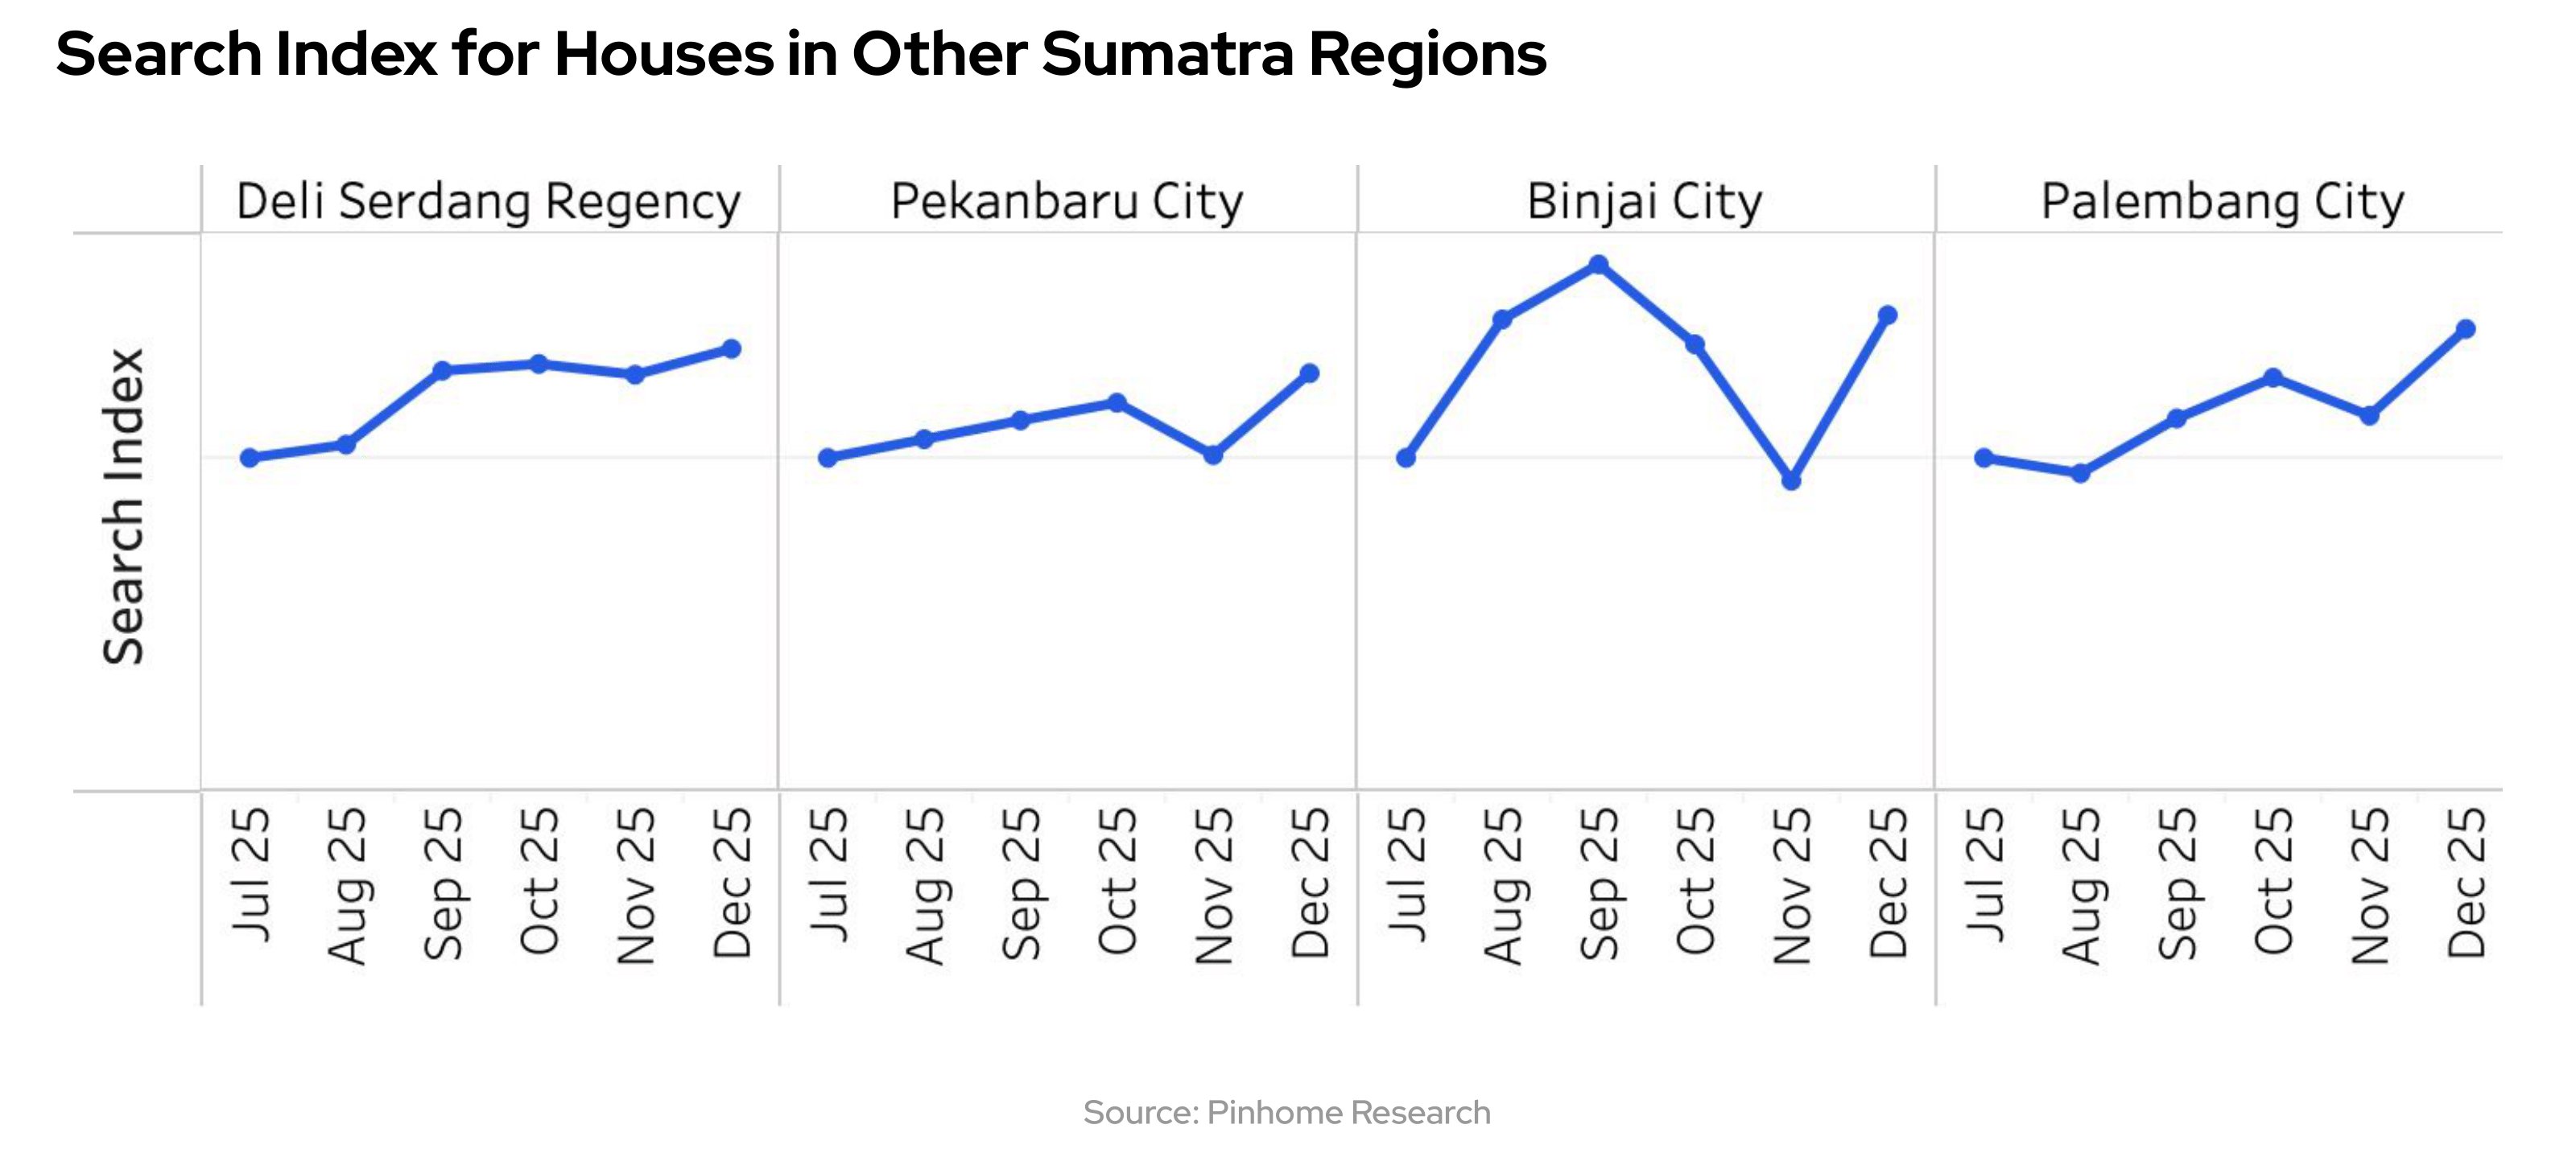
Despite the massive slowdown in the northern region, a different dynamic was observed in other major cities in Sumatra that demonstrated higher levels of resilience. The cities of Pekanbaru and Palembang, for instance, experienced monthly contractions of -13% and -9% respectively in November, partly due to flooding in certain areas. However, the purchasing power in these two cities proved to be very firm; as soon as weather conditions became conducive in December 2025, demand figures immediately surged or rebounded aggressively. Pekanbaru recorded a growth of 24% and Palembang 23% in just one month. This phenomenon indicates that the need for housing in these regions is fundamental; natural disruptions only serve to delay transaction plans without permanently damaging market interest.
Interestingly, market stability was also seen in the major satellite cities that serve as buffers for economic centers. Deli Serdang Regency, as the primary buffer for the city of Medan, showed much more stable performance amidst the disaster, experiencing only a slight correction of -3% in November. In fact, Deli Serdang managed to close out 2025 with positive growth of 6% in December. On the other hand, the city of Binjai, which is also a satellite of Medan, showed recovery signals at the end of the year. Overall, this data suggests that while city centers may be more vulnerable to flooding, satellite regions and growth centers in the southern part of Sumatra offer a more dispersed risk profile and a rapid ability to bounce back from natural factor disruptions.
Market Expansion: The Impact of Commodity Downstreaming
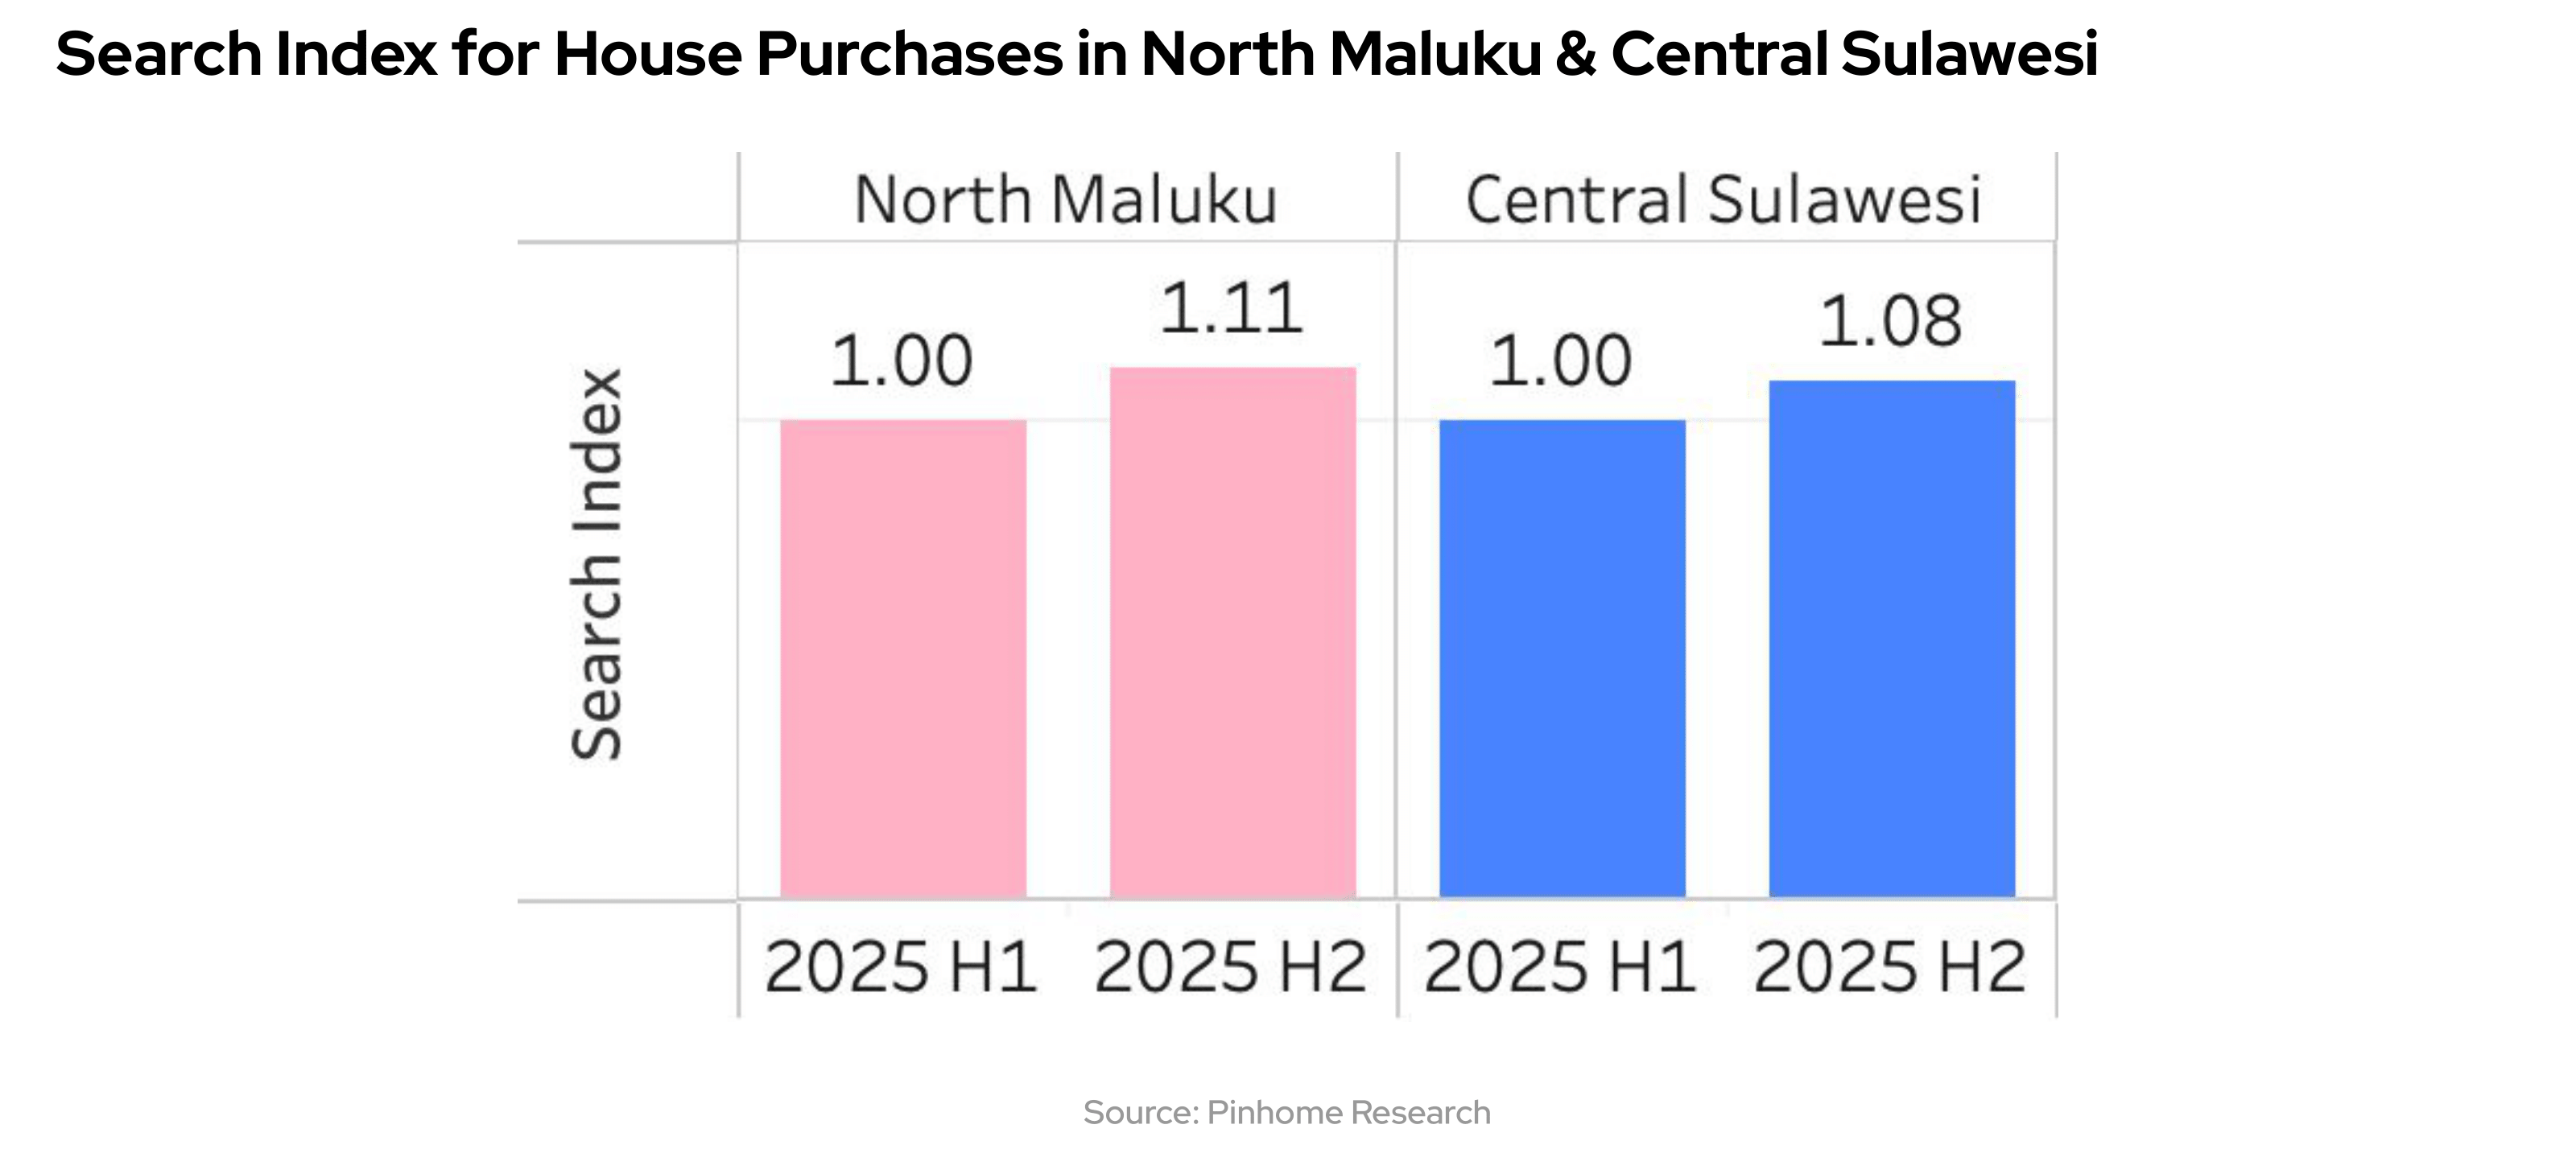
The shift of property growth points outside of Java is accelerating further due to massive natural resource downstreaming policies. This phenomenon is clearly reflected in our internal data, which records very significant house search growth in commodity hub regions. North Maluku Province leads with a semi-annual search increase of 11%, followed by Central Sulawesi, which grew by 8% during the same period. These growth figures, which sit above the national average, prove that economic activity in the upstream sector provides an immediate impact on local residential market demand.
Growth in Central Sulawesi is strongly driven by the expansion of the nickel processing industry, particularly in the Morowali region. As a hub for downstreaming nickel into raw materials for stainless steel and other derivative products, this region continues to attract thousands of new workers and experts. This massive labor absorption not only increases the demand for simple housing for workers but has also begun to shift interest toward more organized residential options for management level and expatriates.
A more aggressive condition is visible in North Maluku, where nickel downstreaming in the Central Halmahera (Weda Bay) and Obi Island regions has become the primary engine of the province's economy. The 11% increase in searches indicates that housing needs around smelter operation sites are expanding as more workers settle permanently. This points to an imbalance between urgent demand and the current availability of housing units, serving as a signal for developers to immediately fill the supply gap in those regions.
The concrete impact on future property trends is no longer centered solely on primary landed houses. There is emerging potential for diversification toward commercial properties and rental housing with better specifications to meet the needs of industry professionals. These downstreaming activities are creating new, independent economic hubs, so the property market is now moving according to strategic commodity processing locations and is no longer entirely dependent on growth in traditional big cities.

Macroeconomic Impacts and AI Technology Acceleration
The property market conditions in 2026 will be heavily influenced by shifts in global monetary policy, particularly the potential pivot by the Federal Reserve. If the U.S. central bank begins to lower interest rates, foreign capital inflows are predicted to return to emerging markets, including Indonesia. This condition provides room for Bank Indonesia to lower the BI Rate, which will directly result in a decrease in mortgage interest rates. For consumers, the early period of this rate decline represents the best entry point for making a purchase before property prices rise again in response to increased demand driven by cheaper credit costs.
In line with these improving monetary conditions, the massive acceleration of Artificial Intelligence (AI) adoption across various sectors is now deeply touching the property industry, both from the perspective of business players and users. Currently, consumers no longer rely solely on manual searches; they have become accustomed to using AI assistance to obtain comprehensive information regarding developer credibility, regional price comparisons, location analysis, and simulations of banking products that best suit their risk profiles. This transformation has made consumers much smarter and more efficient in making large property investment decisions.
Responding to these changes in user behavior, digital players in the property sector continue to build AI-based features to enhance overall efficiency and user experience. Pinhome, as one of the pioneers in this adoption, has integrated AI technology through features like Pinsmart, which functions as a personal assistant for property seekers. Beyond user-facing features, AI also plays a crucial role on the operational side through a listing deduplication engine to ensure data authenticity and a listing scoring engine that automatically assesses the quality and feasibility of every property unit marketed. The integration of this technology not only minimizes information gaps between sellers and buyers but also creates a property market ecosystem that is far more transparent and liquid than in previous years.

About Pinhome Indonesia Residential Market Report
The Pinhome Indonesia Residential Market Report is a semesterly publication presenting a comprehensive analysis of the development and dynamics of the residential market in Indonesia. This report provides in-depth insights into housing inventory (supply), trends in purchasing and rental demand, and the dynamics of demand for home ownership financing, based on the latest data from the previous semester.
Specifically designed to meet the needs of property industry players, policymakers, financial institutions, academics, and the general public seeking to understand the direction and movement of the residential property market, this report serves as an essential reference for strategic planning, decision-making, and market analysis.
Methodology
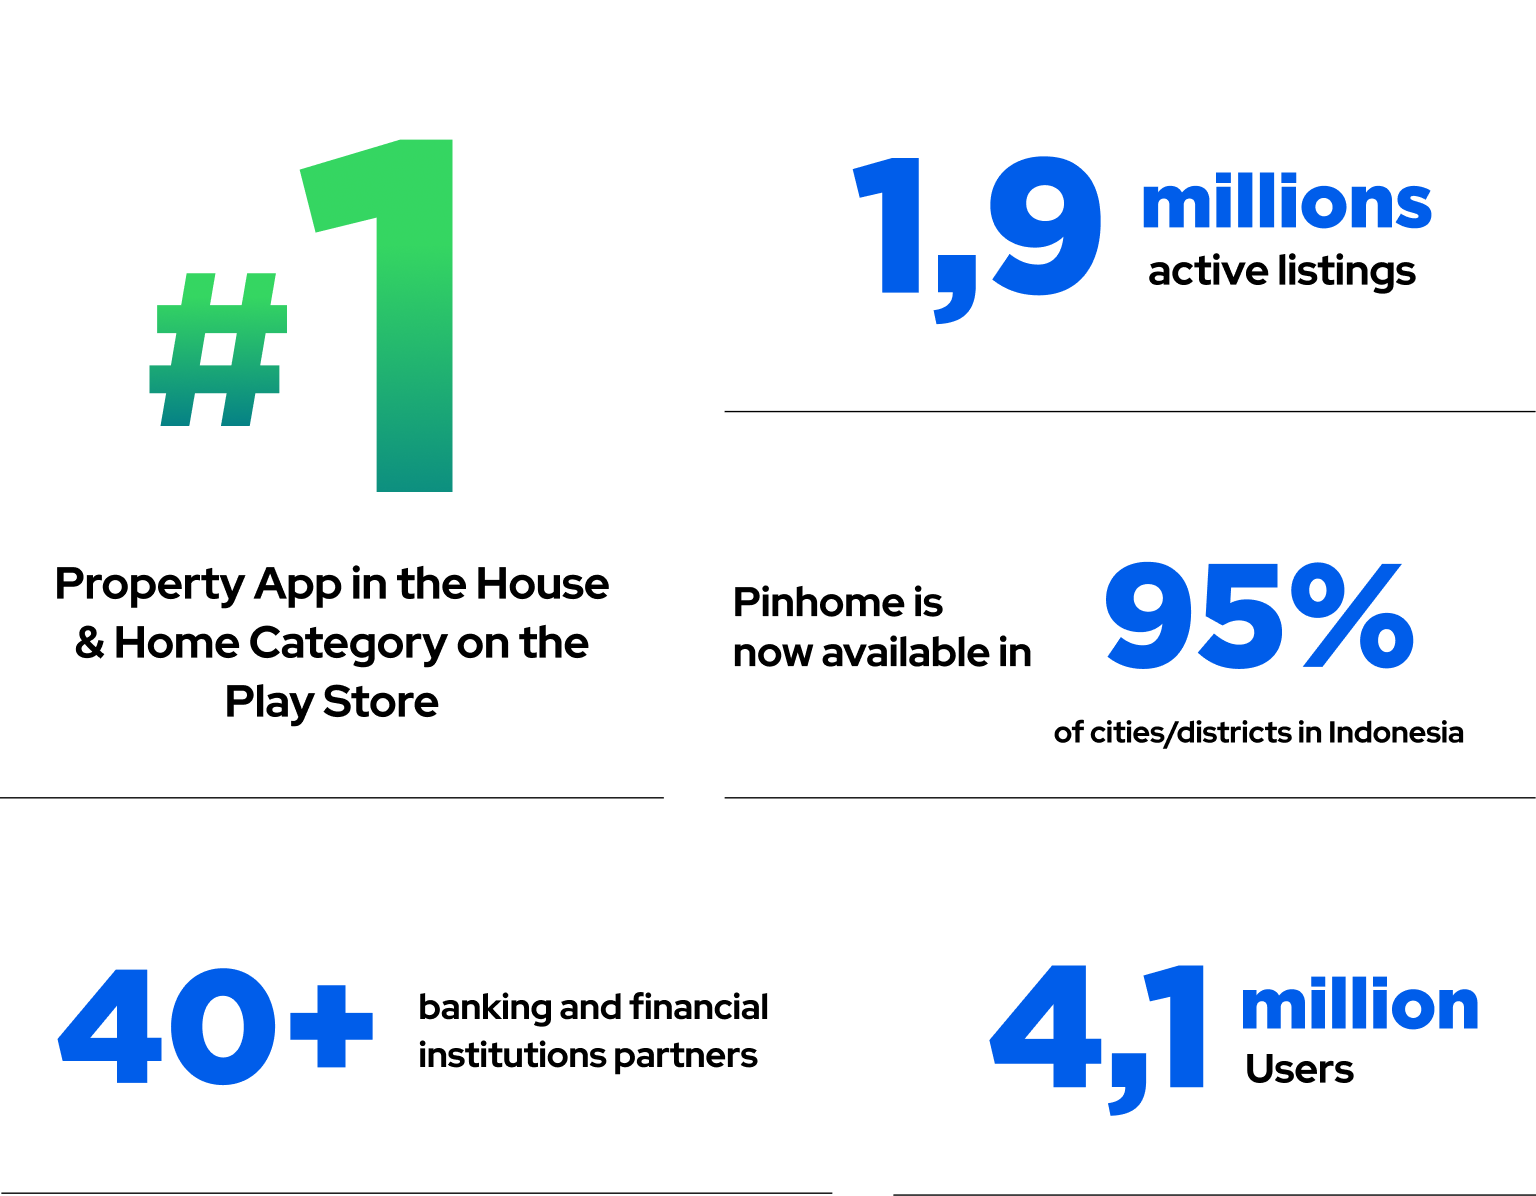
This report is based on Pinhome's extensive internal data, encompassing over 1.9 million residential property inventories from various market segments and supported by strategic partnerships with more than 40 banking and financial institutions. The analysis is reinforced with credible external data sources, then processed using statistical methods and a quantitative approach to generate relevant and accurate findings.
This report presents findings not only at a national scale but also with regional depth that enables more specific mapping of local trends—reflecting the diversity and complexity of the Indonesian property market.
About Pinhome